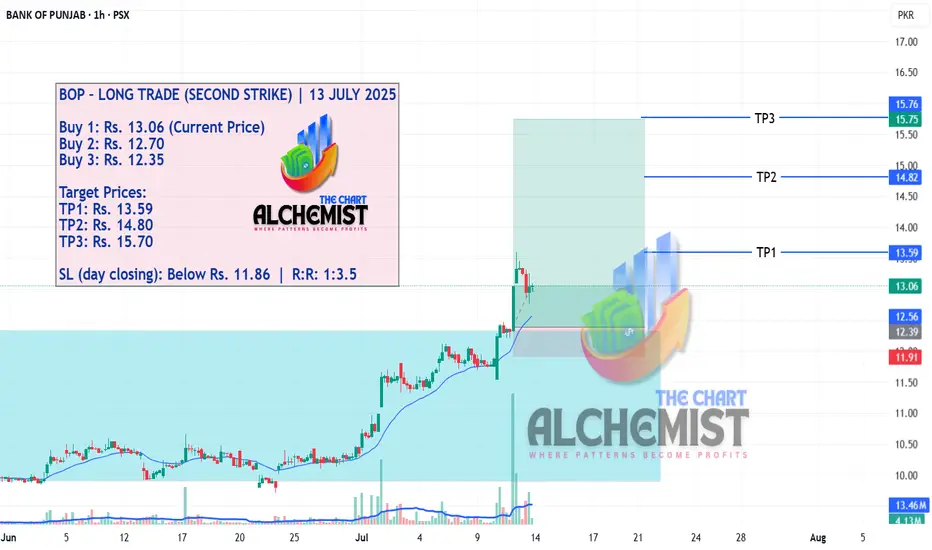
BOP – LONG TRADE (SECOND STRIKE) | 12 JULY 2025BOP – LONG TRADE (SECOND STRIKE) | 12 JULY 2025
Our previous buy call achieved all targets, and in the process, the stock created several bullish structures expected to provide strong support.
BOP trade ideas
BOP SHORT TRADEBOP is continuing on its downward path, it tested its recent breakdown level today, volumes on downside also confirm the scenario
SHORT BOP 9.8-10.2
TP1 8.8
TP2 8.1
SL 10.6

BOP SHORT TRADEBOP has recently broken its upward trendline with heavy volumes
Short sell BOP 9.7-10.7
TP1 8.8
TP2 7.8
SL 11.1

BOP - PSX - Buy IdeaBuy BOP if it breaks above the resistance with a bullish candle. Place you Stop loss 9.15.

BOP Trade SetupThe stock has recently corrected towards its 200-day EMA, currently positioned at PKR 8.99, and has shown signs of stabilizing near this key long-term support level. Historically, the 200 EMA often acts as a strong bounce zone, especially in stocks that have previously demonstrated bullish momentum.
The recent downtrend appears to be losing strength, with declining red volume indicating possible seller exhaustion. A rebound from current levels could signal a short-term trend reversal, offering a favorable risk-reward setup for swing traders.
With moderate volume support and price action indicating potential consolidation, BOP presents a compelling opportunity for investors looking to enter near support with clearly defined risk parameters.

BOP (11.65 breakout level)BOP is recovered and its breakout level is 11.65
Note: This is not a buy sell trade call. Trade at your own will. Use stop loss.

BOP LONG BREAKING HH
BULLISH CUP HANDLE FORMATION CHART shows that it will break ATH and going for a new price discovery

Understanding BOP’s Bullish Trendstock’s strong uptrend, trading within an ascending channel, and currently consolidating within a resistance zone.
The price is currently consolidating within a red resistance box, indicating that it is facing some selling pressure.A breakout above this zone could trigger another bullish rally
Immediate resistance: Around 12.20-13.50 PKR, where the stock is currently consolidating.
12.00-12.20 PKR, act as support for price retraces.
If the price successfully breaks out above 13.50 PKR, it may continue its uptrend toward the next resistance within the channel (15.75-16.25)
However, if it fails to break out, a short-term pullback to the lower trendline (around 12.00 PKR) could provide a better buying opportunity.

Bank Of Punjab Pakistan Stock Exchange "Buy Zone"Bank Of Punjab PSX Pakistan Stock Exchange
Buy Zone
1 Bop Makes Higher High
2 Makes Two Flag pattern
3 Retest Trend line
Buy Zone 10.50
First Target 11
If Break 11 Price
Then Second Target 14.50
Stop Loss 9.40

BOP LONGEntry, stop-loss all there. As soon it breaks that channel should rip to the upside. Manage your risk!

BOP is reaady to flyPositive momentum of BOP since last few days and breaking level of 5.75 it is likely to break 7.86 level to fly 9 and above levels.
Note: This is not a buy/sell call. Use SL as per your strategy.

BOP - A Prime Buying OpportunityThe stock of BOP has been experiencing a downtrend. However, recent indicators show a bullish divergence, suggesting a potential reversal. The break of the neckline, which corresponds to the previous lower high, followed by a retest of this level, indicates that bullish momentum may be building. This presents a promising buying opportunity for traders.

BOP is BullishPrice was moving in a declining phase, however a bullish RSI divergence appeared on daily time frame, which led to the break of previous lower high and now bulls are in control of the price action. If this freshly printed higher high is broken successfully, then we can expect aa bullish rally. Targets are mentioned on the chart.

BOP Bullish ReversalAs it can be seen that the trend is reversed as it formed bullish divergence and it also have crossed the previous lower high.

BOP🚀 Stock Alert: BOP
📈 Investment View: Technically Bullish 📈
🔍 Quick Info:
📈 Entry Range: 5.50-5.60
🎯 First Target : 5.80
🎯 Second Target : 6.36
🎯 Target Target : 8.20 (Long Term)
⚠ Stop Loss: 5.23
⏳ Nature of Trade: Swing Trade
📉 Risk Level: Medium
☪ Shariah Compliant: NO
💰 Dividend Paying: YES
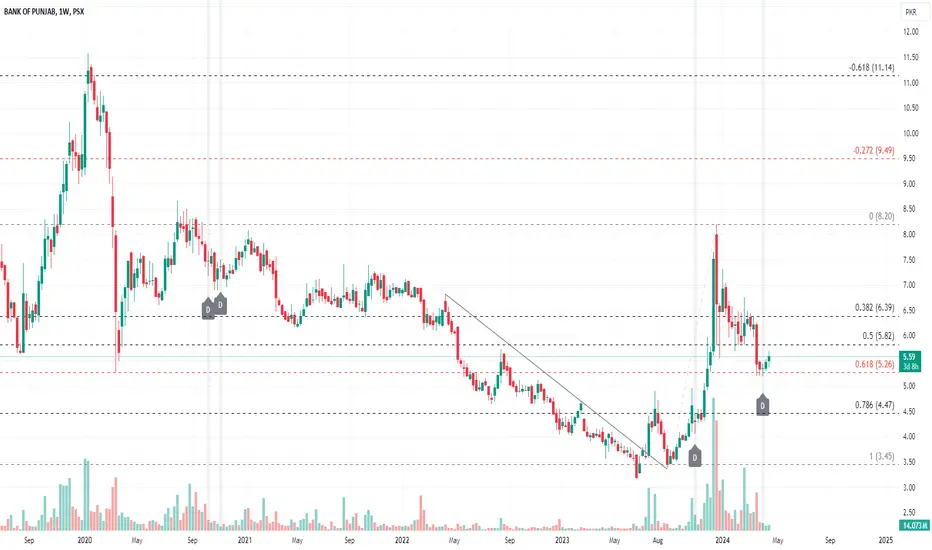
📰 Technical View: On the weekly timeframe, BOP indicates a retracement from its support level of 5.23, representing a 61.8% retracement, coinciding with the appearance of a doji candle on the chart. This setup suggests a swing trade opportunity, with a stop loss set at 5.20 and initial targets at 5.80 and 6.36. For those considering a long-term approach, the previous high of 8.20 could serve as a potential target.

BOP is BullishBOP is in a strong bullish momentum and is printing higher highs and higher lows, the rally is expected to continue in coming days and weeks. Targets are mentioned on the chart.
