DGKC Long on 1HDGKC has printed bullish divergence on RSI on 1H timeframe and has broken previous LH and downward trendline indicting a short term Long position until R1. My entry, TP and SL are marked on the chart.
DGKC trade ideas

DGKC a potential trade with 10% profitDGKC in PSX in hourly time frame has closed above EMA50 on Friday with current price of 99.75. If viewed closely, the channel formed from 20th December bottom is intact. previous high price is around 110.
In Monday's session, it is expected to stay above EMA50 which is 100 now, buying here with a target of 110 or channel top is around 113 can give 10% plus profit in a shorter period.
MACD, RSI and my own combined indicators are adding support to this view.

DGKC PSX IDEABased on previous bull run and support and resistance, DGKC looks good for long-term investment.

Beautiful Bullish Engulfer on Daily TF.Beautiful Bullish Engulfer on Daily TF.
61.8% fib retracement done around 90.50 - 91
Stock is Still Bullish on Bigger Time Frames.
If 96 is Sustained, we may easily wintess an
upside around 103 - 105 initially.

DGKC-LONGDGKC is trading in a bullish trend and now price has started reversal after correction so we will take long entry at CMP

DGKC ready for long positionDGKC is taking continuous support from daily EMA 200.
RSI is around 30 so ready to make a move.
TPs and support is showing in the chart
DGKC Trade1. Bulish trend
2. break of continution pattern
3. break of resistance and sustane
4. no bearish divergence
5. long trade
6. TPs hit 40% increase


DGKC potential Buy setupReasons for bullish bias:
- Price gave a bullish closing above the weekly support level
- Price bounced from fib golden pocket
- Price gave downward trendline breakout
- AB = CD pattern can be seen, if price give resistance (also TP1) breakout, then next target can be considered at point D(approx. 105)
- Overall a bullish trend on daily
- Bullish divergence
Here are the recommended trading levels:
Buy 1: 87.03 (CMP)
Buy 2: 81.5
Stop Loss Level: 72.04
Take Profit Level 1: 96.5
Take Profit Level 2: Open
Happy Trading

DGKC is BullishThe macro trend was bullish, however the price went down for retracement and was respecting a descending trendline since August, however now it has given a breakout after the emergence of bullish divergence. Bulls seem to be in complete control of the price action and previous lower high is also broken successfully, hence we can expect new highs as per Dow theory. Moreover, the reversal also came from 0.67 of Fib retracement which is a potential reversal zone for AB = CD projection. Targets are mentioned on the chart.

DGKC can cross 80 and above levelsYesterdays results and move from 73 to 80 yesterday and today maintaining support in 78 and 79 levels. It could cross these defined levels in few days.

DGKC future presiction Currently its in middle, 50% position to move up or down,
Next week will see
I will make complete video on it

Bearish Divergence on Weekly TF.
Already made a Lower High on Daily TF.
If 75 is not Sustained on Weekly Basis,
we may witness 66 - 68.


PSX DGKC ReversalPrice taking support around 78 level.
Divergence being formed
Can take position when the price crosses 81 or MACD Blue line crossing above orange line or both.

* Bullish on Weekly as well as Monthly TF.
* 94 - 96 is a Strong Resistance for now.
* On the flip side, 90 - 91 may act as a
Strong Support.
* If 96 is Sustained, we may witness 105 - 106
initially.
* For Swing Traders, 82 should be the Stoploss
on Closing basis.

DGKC ON RETEST ..Bullish sentimentsDGKC on a retest its last resistance..it could be an good accumulation zone tarets are longs...easy targets are 103-105 .After confirmatation of retest further position can be attained in this script.As still this sector need to perform .KSE100 plays an important role if KSE supports the breakouts on its charts DGKC is good to go.

DGKC is BullishDGKC has printed first higher low and is on course to break previous lower high. This would trigger a bullish rally according to Dow theory. Targets are mentioned on the chart.

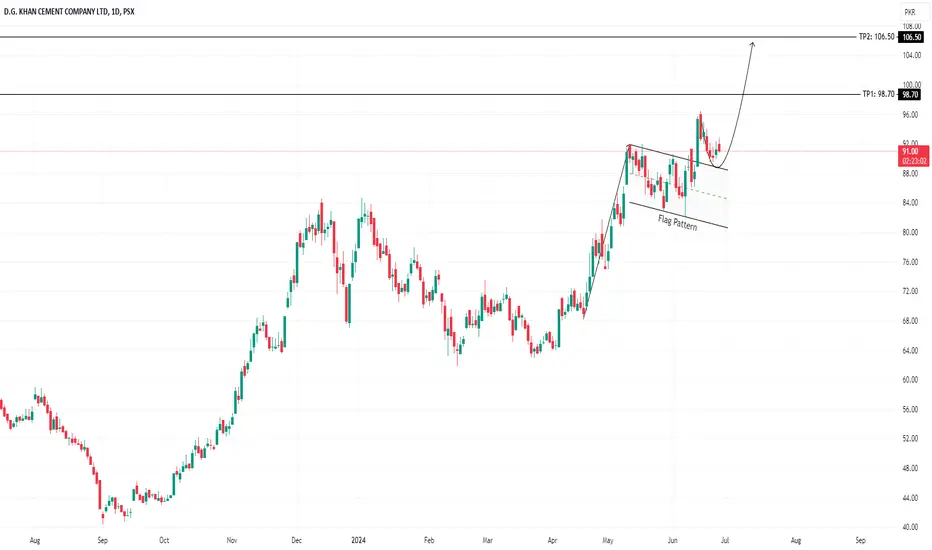
DGKCAfter undergoing a breakout and subsequent retest, the prior resistance level at $68.70 has transitioned into a supportive role. This strategic evolution suggests the viability of establishing long positions with a target price set at $77.40.

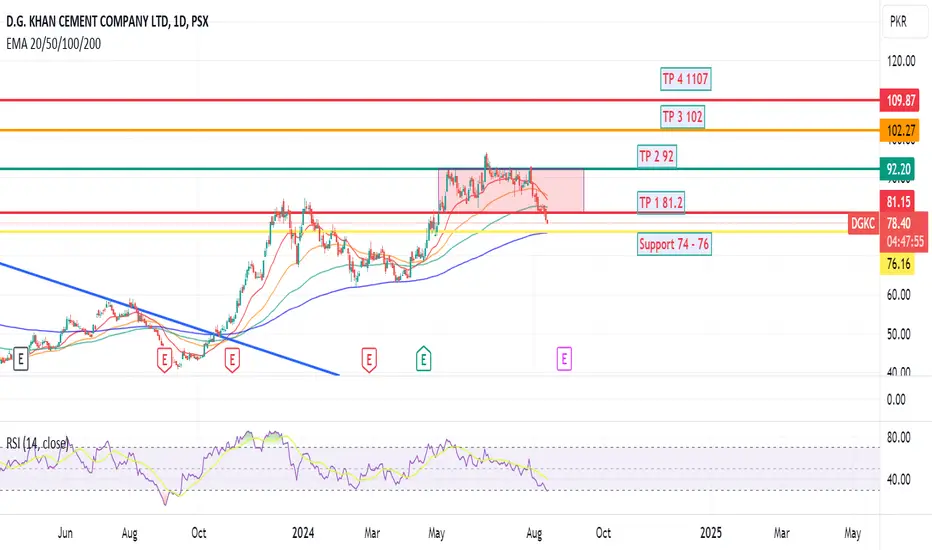
D.G. Khan Cement Company LimitedThe price is declining after making a double top pattern around 84 level and recently gives closing at 64.55 which is -23% in the last trading session. Looking forward to the stock has recent support at 63.50 and second at 59 where accumulation can be seen. On the flip side, immediate resistance lies at 68.70 which breaks and sustains can pull towards 77.40 as shown in the chart.

DGKC DG KHAN CEMENT price was reacting well the support and resistance
and formed a bullish div , If the market successfully sustain this bullish confluence the next leg high could go for new HH.
NFA
DYOR

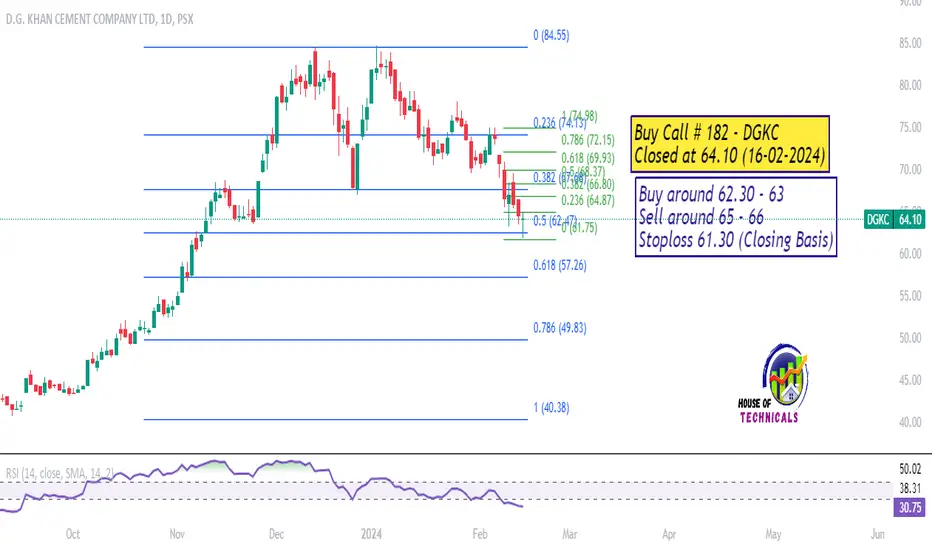
Bullish Divergence on Hourly TFBuy around 62.30 - 63
Sell around 65 - 66
Stoploss 61.30 (Closing Basis)