EFERT PROBABLY IN WAVE " 3 "- LONGThis is in continuation of our ongoing EFERT wave tracking
Last week price just broke above 214 (check previous posted idea/chart) providing confirmation that either the 4th wave is completed or it will further unfold into a complex correction.
Our preferred wave count suggest that wave 4 is over and we are in the 5th wave which will take price toward 265 - 270 and then 310 - 330 levels
Alternately, prices will consolidate sideward for a couple of more weeks before starting its upside move.
Unfortunately, we are not trading this setup at the moment because our hands are full.
Let see how this plays, Good Luck!
Disclaimer: The information presented in this wave analysis is intended solely for educational and informational purposes. It does not constitute financial or trading advice, nor should it be interpreted as a recommendation to buy or sell any securities.
EFERT trade ideas

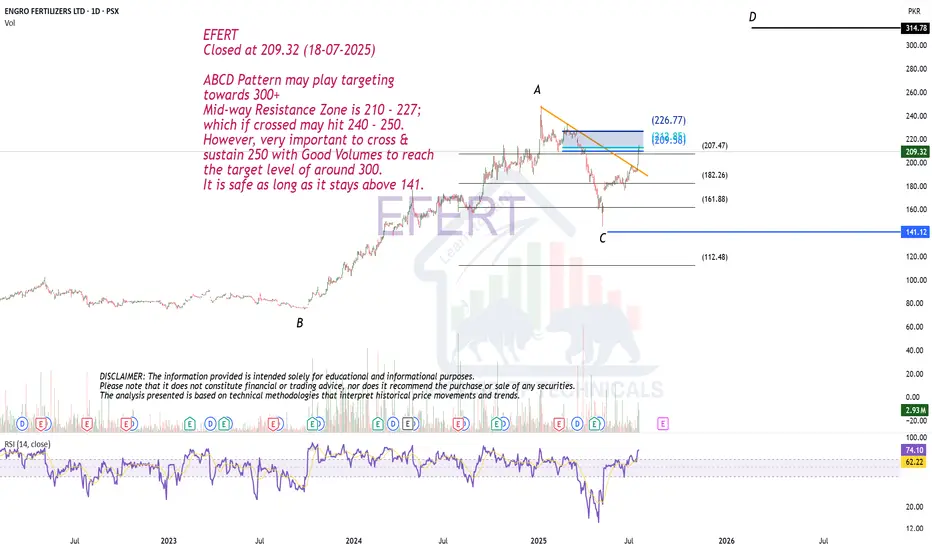
ABCD Pattern may play.EFERT
Closed at 209.32 (18-07-2025)
ABCD Pattern may play targeting
towards 300+
Mid-way Resistance Zone is 210 - 227;
which if crossed may hit 240 - 250.
However, very important to cross &
sustain 250 with Good Volumes to reach
the target level of around 300.
It is safe as long as it stays above 141.
EFERT Consolidation BreakoutEFERT has given the Consolidation Breakout and can provide short-term as well as long-term targets.

Bullish Divergence in EFERTThere is a bullish divergence observed in the EFERT chart on the daily timeframe. The current downtrend has already reversed and will be confirmed if the previous LH is broken and a new HL is formed. If the previous LH is broken, it will be a good time to take a long position as indicated on the chart.

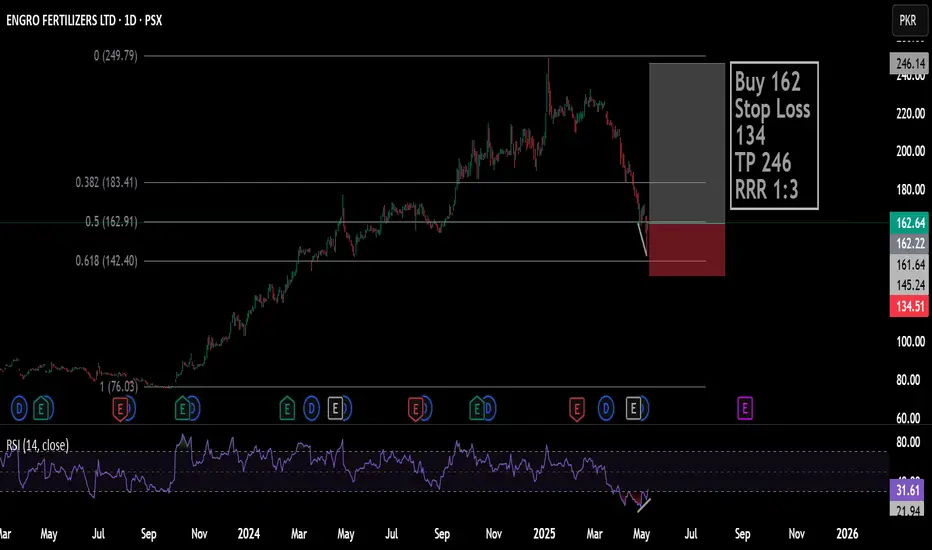
EFERTTrend is Bulish price retrace at fib level 0.618% with Bulish divergence
target price last High
Buy 162
Stop Loss 134
TP 246
RRR 1:3
EFERT PROBABLY IN WAVE '' 3 '' OR " C " - LONGEFERT is most probably in wave 3 or C of a higher degree wave 4 or A, if our wave count is correct then wave 3 or C is almost ending and prices should take support from 165-160 range level.
Alternately prices can go toward our main buy zone directly i.e. 160-140 range in which the prices might reach 145-140 level easily but our preferred setup suggests that prices will take support around 165-160 range bouncing of the yellow trendline.
We will take a small position at 165-160 level and if prices goes further down we will add more at 145-140 level, based upon our little knowledge we find EFERT fundamentally strong and reasonable at prices around 160-140 but of course cheaper is always better.
If our wave count is correct then we can make around 12% to 21% on this trade.
Trade setup:
Entry price: 165-160
Stop loss: we will update stop loss once prices start to rise from our buy zone
Targets:
T1: 185-195
Let see how this plays, Good Luck!
Disclaimer: The information presented in this wave analysis is intended solely for educational and informational purposes. It does not constitute financial or trading advice, nor should it be interpreted as a recommendation to buy or sell any securities.

Live Buying Signal in EfertOur Custom indicator Signals Wala Jin generated live Khareedo (Buy) signal in Efert at 175.45. Lets see how long it will go up.
Note: This is not a buy sell trade call, trade at your own will and analysis. Use stop loss.

EFERT : Bullish Divergence Trading Setup (Hourly Time Frame)EFERT : A Bullish Divergence has been identified between Price and Momentum indicators on the Hourly chart, signaling a potential Bullish Reversal. This divergence suggests weakening downside momentum and increasing probability of an upward move.
Entry levels and Target Prices (TPs) are clearly marked on the chart.
Traders are advised to consider the Stop Loss (SL) at the level indicated on the chart to manage risk effectively.
This setup favors bullish positioning with calculated risk-reward parameters. Monitor price action around the entry zone for confirmation before execution.

Efert Analysis- Bear Trap13/4/25
TF 1W/1D
Efert was trending inside a bullish channel since Oct 23
Although it has given a breakdown from the channel but this move can convert into Spring or Bear Trap. It will be confirmed with a daily closing above 190 within next 3 days
Buy 192-199
Short term TP 229 & 248
Long term TP 310 ( Oct 25)
In Sha Allah
SL below 180

Wait for a Bullish Sign!Important Support Zone
166 - 184
Somewhat Bullish on Monthly TF,
But if 180 breaks,we may witness
further selling pressure.


Efert could drop to 200 to 188Technically efert is dropping its support level and it is expected to more drop to 200 and 188 level
Note; This is not a buy sell call, use stop loss too.


EFERTtrend is bulish dow thery is making hh and hl.
now price is retracment at fib level 0.618%
target is last high.

EFERT is heading to 215 againEFERT is dropped from its support of 192.5 and again bounce back and cross above 192.5 level. Fresh entry could be possible and it is likely to cross 201 and 215 again. TP 1 is 201 TP 2 is 215. Stop Loss 185.
Note: This is not a buy/sell call. Trade at your own will.

Efert, Bullish Channel facing ResistanceBullish Channel
Double top formation
Bearish Divergence
currently facing horizontal resistance
closing above 215 will Triger another rally
Buy on closing above 215
Initial target 230-240

EFERT 214.12 breakout levelEfert could reach 250 level after breakout 214.5
Note: This is not a buy/sell call. Use Stop loss as per your strategy.

EFERT on the ride for 250-300 targets. EFERT show potential to go on the ride for 250-300 targets.
Accumulation below 200 is a good chance to avail the golden ride.


LongBuy @ CMP (around 166 - 170)
Sell around 175 - 176
Stoploss 164.50 (Closing basis)
Then we should wait for 177
to Cross & Sustain; Target 200

EFERT Breakout & Reversal: Chart Analysis & Trade StrategiesCurrent Price: 168.00 PKR
Resistance Levels: Weak High: Around 175 PKR
Support Levels:
Strong Low: Around 145 PKR
Intermediate Support: Around 155 PKR
Trend:
The stock has shown a recent uptrend with a sharp rise from the lows. The consolidation phase appears to be occurring between 160 PKR and 170 PKR.
Report Insights :
Earnings Expectations: Expected EPS for 2QCY24 is 3.85 PKR, which is a 52% decline QoQ. Expected DPS is 4.0 PKR for 2QCY24.
Operational Challenges: Decline in sales volume due to the Enven plant's turnaround until mid-Jun-2024. Net revenue is expected to decline by 43% QoQ.
Market Performance: EFERT has outperformed the KSE100 Index with a 49% gain YTD.
Trade Strategy for Engro Fertilizers Ltd (EFERT):
Breakout Trade:
Entry: 175 PKR
TP1: 185 PKR (5.11%)
TP2: 200 PKR (13.64%)
SL: 170 PKR (3.41%)
RR Ratio: 1.5 (TP1), 3.53 (TP2)
Reversal Trade:
Entry: 155 PKR
TP1: 170 PKR (9.68%)
TP2: 185 PKR (19.35%)
SL: 150 PKR (3.23%)
RR Ratio: 3 (TP1), 6 (TP2)
Key Trade Confirmation Points:
Volume: Look for increased volume on breakout above 176 PKR or on dip buying at 155 PKR.
Candlestick Patterns: Watch for bullish reversal patterns near support levels or strong bullish candles on breakout levels.
Market Sentiment: Keep an eye on overall market trends and any news specific to the fertilizer sector or EFERT.
Confluences:
Sector Performance: The fertilizer sector's relative strength compared to the KSE100 Index supports a bullish outlook.
Dividend Announcement: A confirmed dividend of 4.0 PKR/share could boost investor confidence.
Technical Indicators: Use RSI, MACD, or moving averages to confirm entry points and momentum.

EFERT Breakout & Reversal: Chart Analysis & Trade Strategies*EFERT Chart Analysis:*
*Current Price:* 168.00 PKR
*Resistance Levels:* Weak High: Around 175 PKR
*Support Levels:* Strong Low: Around 145 PKR
*Intermediate Support:* Around 155 PKR
*Trend:* _The stock has shown a recent uptrend with a sharp rise from the lows._
_The consolidation phase appears to be occurring between 160 PKR and 170 PKR._
*Report Insights:*
*Earnings Expectations:* _Expected EPS for 2QCY24 is 3.85 PKR, which is a 52% decline QoQ._
_Expected DPS is 4.0 PKR for 2QCY24._
*Operational Challenges:* _Decline in sales volume due to the Enven plant's turnaround until mid-Jun-2024._
_Net revenue expected to decline by 43% QoQ._
*Market Performance:* _EFERT has outperformed the KSE100 Index with a 49% gain YTD._
*Trade Strategy for Engro Fertilizers Ltd (EFERT):*
*Breakout Trade:*
- *Entry*: 176 PKR
- *TP1*: 185 PKR (5.11%)
- *TP2*: 200 PKR (13.64%)
- *SL*: 170 PKR (3.41%)
- *RR Ratio*: 1.5 (TP1), 3.53 (TP2)
*Reversal Trade:*
- *Entry*: 155 PKR
- *TP1*: 170 PKR (9.68%)
- *TP2*: 185 PKR (19.35%)
- *SL*: 150 PKR (3.23%)
- *RR Ratio*: 3 (TP1), 6 (TP2)
*Key Trade Confirmation Points:*
_*Volume:* Look for increased volume on breakout above 176 PKR or on dip buying at 155 PKR._
_*Candlestick Patterns:* Watch for bullish reversal patterns near support levels or strong bullish candles on breakout levels._
_*Market Sentiment:* Keep an eye on overall market trends and any news specific to the fertilizer sector or EFERT._
*Confluences:*
_*Sector Performance:* The fertilizer sector's relative strength compared to the KSE100 Index supports a bullish outlook._
_*Dividend Announcement:* A confirmed dividend of 4.0 PKR/share could boost investor confidence._
_*Technical Indicators:* Use RSI, MACD, or moving averages to confirm entry points and momentum._
