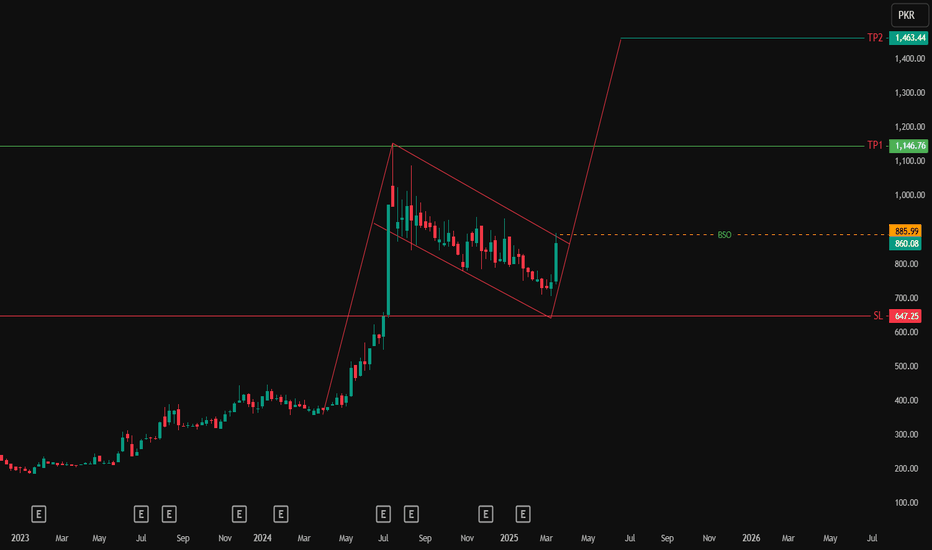
EXIDE trade ideas
Exide Pakistan - LongExide is making multiple bullish patterns
1- Inverse head and shoulder
2- Cup and Handle
3- Bullish Flag
4- ABCD pattern
It may go down to 670 at the worst, but may also revert back from here to complete CD leg which may touch 1600.
Short term target: 1100
Medium term target: 1600
Long term target: 2000
EXIDE offers more than 55% gains on prevailing price LevelsThe stock is in Bullish Momentum, for those, willing to take secure trades, should enter at a price above 1166 for the Target of 1458 potentially can make 25% gain on these levels.
However, anyone wish to take calculated risks, can enter the trade now with the SL of 775, for TP1 of 1101, TP2 of 1264 and TP3 of 1427 with upside potential over 55%
EXIDE PAKISTAN LTD. in PSXExide Pakistan Ltd. Chart Analysis
Current Trend: Moving within a channel
Support Levels: 880 to 866 area
Resistance Levels: 1020 to 988 area
Stop Loss: 820
Long-Term Outlook: Forming a bullish flag pattern
Visual Representation:
| 1020 |------------------ Resistance
| |
| 988 |------------------ Resistance
| |
| |
| 880 |------------------ Support
| |
| 866 |------------------ Support
| |
| 820 |------------------ Stop Loss
Summary:
Support: The stock is finding support in the 880 to 866 area, indicating a strong buying interest at these levels.
Resistance: The resistance zone is between 1020 and 988, where selling pressure might emerge.
Stop Loss: Setting a stop loss at 820 helps manage risk in case the stock moves against the expected trend.
Bullish Flag: In the long run, Exide Pakistan is forming a bullish flag pattern, which is typically a continuation pattern indicating potential upward movement after a period of consolidation.
EXIDE on Hourly Time FrameOn hourly basis Scrip is in upward trend after having taken a correction of 38.20% and also touched 23.60% Fib levels towards the upside. This is indicative of the fact that the stock may move towards the upside. Approximate upside zone marked. Also KSE is currently unstable and jolting, which may have a negative impact on the overall market and the stocks as well. In case the stock moves downwards then it may hit the below marked zones
EXIDE - WEEKLY: C&H BREAKOUTEXIDE - C&H formation in weekly time frame, Stock breaking out @ 409 closing abv on weekly basis will confirm the further bullish momentum.
The key support IS @ 377 - 360 LEVELS.
The immediate targets are set @ 450 - 469 - 482 - 503.
IN MEDIUM TERM PERSPECTIVE TP: 513 - 550 - 616 & 756.
⚠ LOW LIQUIDITY STOCK & SLOW MOVER
EXIDE (batteries) trading Well below the book valueHigh potential and trading well below the book value ; managing the product (Exide inverter batteries and lead batteries ) which is in high demand in summer season.
It looks like that EXIDE is gainining momentum.
Already tested 23% Fibonacci at 635/- in 2022. If EXIDE delared FY good results it may shoot to 38% which is Rs:900+


