FABL | Growth Potential AheadAccording to its price action, FABL is currently trading within a corrective structure, with a strong support zone identified at 45, offering a strategic entry opportunity for long positions. The price is moving within a downward-sloping channel, indicating a consolidation phase, with a potential breakout towards higher levels.
Entry Zone: Around 45
Stop Loss: Below 43
TP1: 51
TP2: 54
Risk To Reward Ration = 1 : 4.50
FABL trade ideas

FABL | Bullish Pennant PatternAccording to its price action, FABL is currently testing 200-day EMA and forming bullish pennant pattern which need a break out. Offering a strategic entry opportunity for long positions. On the flip side, short term resistance levels are 50.97, 53.84 and 56.21 and pennant pattern projection lies around 77. Price reversal if it breaks moving average and stop loss level is 40.

FABL PSXFABL is in good area to buy below 50 and target is 60+, SL and target are beautifully defined on the chart as shown.

FABL is heading to 56Faysal Bank is breaking Psychological
Resistance of level of 50and ready to fly to 56 and 60
Note: This is not a buy/
sell call. Use stop loss

Faysal Bank 28 Nov 2024 zonesBullish zone 46.5
Bearish Zone 45
Note: This is not a buy/sell call. Use stop loss whenever trade.

FABL 27 Nov 2024 Bullish zone is above 50
Bearish zone is below 45
Note: This is not a buy/sell call. Use stop loss whenever trade.

FABL PSX 1D ABCD PatternFABL : The daily chart shows an ABCD pattern suggesting a potential bullish move toward point D (Target) if the price breaks above point B (entry level) .

Faysal Bank Long Trade PlanFABL is currently forming a bullish flag pattern which may break out to meet its recent high of 58.10 again. However 58.10 level should be closely watch out for double top formation and consequent rejection. However in case of breaking recent high of 58.10 then price projection of flag pattern stands at 78.

FABL potential Buy setupReasons for bullish bias:
- Price respecting upward trendline
- Harmonic AB=CD pattern formation
- Price is at horizontal support
- Safe entry can be taken after a bullish candle closing
- No divergence
Here are the recommended trading levels:
Entry Level(CMP): 47.15
Stop Loss Level: Closing below 43.5
Take Profit Level 1: 52.59
Take Profit Level 2: 57.41
Take Profit Level 3: 72

FABL, Bullish Flag, Entry at Retracement Bullish Flag
Breakout of Bullish Flag
currently Retracing at 38% fib
Buy in parts at current price and 48-49 level
Stoploss below 43
Target is 73

FABL 1D PSX : AB=CD PatternFABL : ABCD pattern is spotted on daily chart depicting a bullish movement after confirmation level. Good financial results and 50% payout ratio may be key tools for value realization.


FABL DAILYScrip is Bullish on HTF i.e. Weekly and Monthly and LTF as well BUT it is Bearish on DTF, H4 and M15 Time Frames due to the following reasons: -
Candles are engulfed in the cloud
Formation of a RED cloud ahead, though it is not very dense
Base Line is ABOVE Conversion Line.
Lagging Span has also pierced the candles and if the scrip remains in the consolidation / rangebound state, may inevitably pierce the cloud as well.
BB was slanting downwards, which has recently changed its angle to horizontal.
Daily RSI Value 53.43
ADX 14.56
+DI is ABOVE -DI, BUT with meager margin
The +ve point is that the Conversion Line has changed its angle and started to move Up, which if it continued will result in its crossing with the Base Line and pave way for the scrip's upward movement.


Faysal Bank Limited (FABL) Chart AnalysisPattern Identification
The pattern visible on the FABL chart appears to be an Ascending Triangle pattern rather than a Rising Wedge. Ascending triangles are typically bullish continuation patterns.
Key Features
Ascending Triangle:
The upper trendline is horizontal, indicating a strong resistance level.
The lower trendline is ascending, showing higher lows.
The pattern suggests accumulation and potential breakout above the resistance level.
Fibonacci Retracement Levels:
The chart shows Fibonacci retracement levels which can act as support and resistance.
Resistance and Support Levels:
Major resistance: Around PKR 44.88.
Key support levels: PKR 32.02 (38.2% retracement), PKR 28.04 (50% retracement), PKR 24.07 (61.8% retracement).
Current Price Action
The current price is PKR 40.78, approaching the resistance level of PKR 44.88.
Future Forecasting
Bullish Scenario:
If the price breaks above the resistance level of PKR 44.88 with strong volume, it could indicate a bullish breakout.
The projected price target could be estimated by adding the height of the triangle to the breakout point.
Bearish Scenario:
If the price fails to break above the resistance and starts declining, it could retest the support levels around PKR 32.02, PKR 28.04, and PKR 24.07.

FABL (ANALYSIS)
🚩 Market Update 📈
FABL Analysis:
Technical Pattern: FABL has formed a bullish flag pattern with a target of 47.
Indicators:
RSI: Showing a bearish divergence.
Daily Channel Top: Closing with high volumes.
Trade Recommendation:
Neutral Stance: I suggest staying neutral for now.
Trade Option: If you choose to trade, consider buying at current levels.
Risk Management: Use trailing stop-loss initially, otherwise set SL at 40.70, with the next SL at 41.7 (closing basis only).
Wishing you profitable trades! 📊📈

FABLAS it FABL showing by both macd, RSI and Bollinger brand buy signal and also last monetary policy rate is also fixed and it not coming low this year if it then it will be few basis point

Faysal Bank ( Bullish Trend towards Bearish Trend )FABL , ( Dow Theory )
( Bullish Trend towards Bearish Trend )


FABL is BullishFABL is currently in a strong up-trend and bulls are in complete control. According to Dow theory the trend is printing new higher highs and higher lows, with no RSI divergence on daily time frame, this bullish momentum is more likely to continue in coming days. Targets are mentioned on the chart.

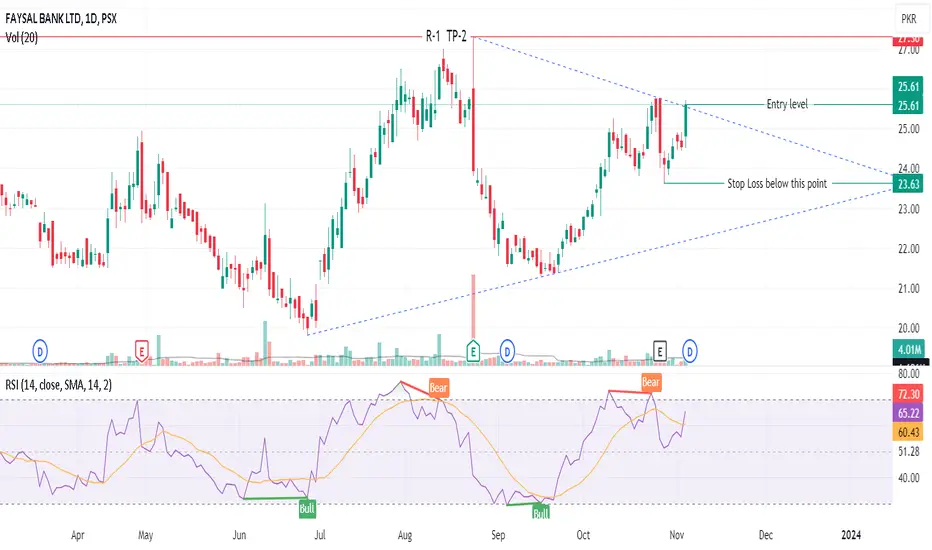
PSX: FABL; IS IT PREPARING FOR A LONG HAUL TO NORTHFABL has been striving to upgrade itself in to upper price bracket. Last successful attempt
was in September 2021. Since than it has been in the broader price range of Rs.20 and Rs.32. Now at current price level the momentum is good which is coinciding with a bull rally at PSX and it is also on the verge to breach the Triangle which it started forming from the last week of June. If the triangle is successfully crossed, the target for the script shall be Rs.33 which means the all time high. Therefore, it is expected it may explore new peaks "beyond the last mountain". Another feather in the cap is this has become the ISLAMIC bank which has its own perks and privileges in the arena of banking industry of Pakistan
So be prepared for the new vistas.
Profitable trading is Happy Trading

FABL:PSX has formed Bullish Flag continuation patternFABL:PSX is presently in uptrend as it is printing HHs and HLs. The price pattern has recently formed a Bullish Flag continuation pattern on 1H timeframe. Entry (Buy Stop) has been planned on breakout above the Flag-pole with SL placed below previous HL. Projected Price Potential, TP1 and TP2 have been suitable placed. RSI has shown no divergence therefore it is understood that the stock is likely to continue uptrend after reaching Entry Price.
