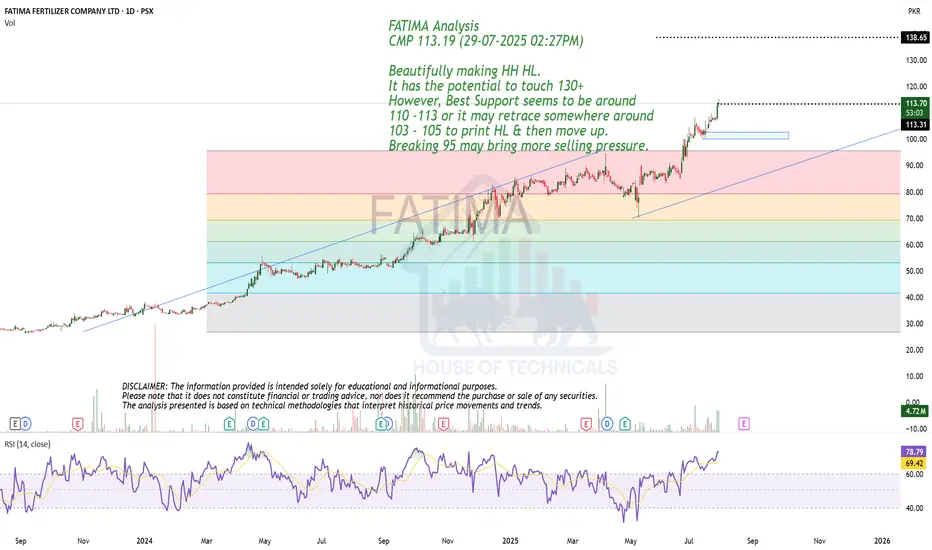
Beautifully making HH HL.FATIMA Analysis
CMP 113.19 (29-07-2025 02:27PM)
Beautifully making HH HL.
It has the potential to touch 130+
However, Best Support seems to be around
110 -113 or it may retrace somewhere around
103 - 105 to print HL & then move up.
Breaking 95 may bring more selling pressure.
FATIMA trade ideas

Bullish on Bigger Time Frames.
Immediate Resistance is around 82 - 82.50
Crossing & Sustaining 83 may lead it towards
90 - 91.
On the flip side, 77.50 & 74.50 are immediate
Support levels.
It should not break 69 in worst case; it may reverse
the trend.

FATIMA - PSX - Daily - Buy Trade Call AB=CD Harmonic PatternOn Daily TF, AB=CD pattern has been drawn.
RSI indicator suggests that a hidden bullish divergence is in play at the moment which is taking prices up. Moreover, Klinger Volume Oscillator suggests that a Bull run is about to begin but at a slow pace; if in next couple of days Volumes are generated then chances will become even brighter for the bull run.
Price is currently testing previous Higher High. If it is broken by a significant margin only then taking entry in the trade is in order. Fib Extension Tool has been used to arrive at a TPs.
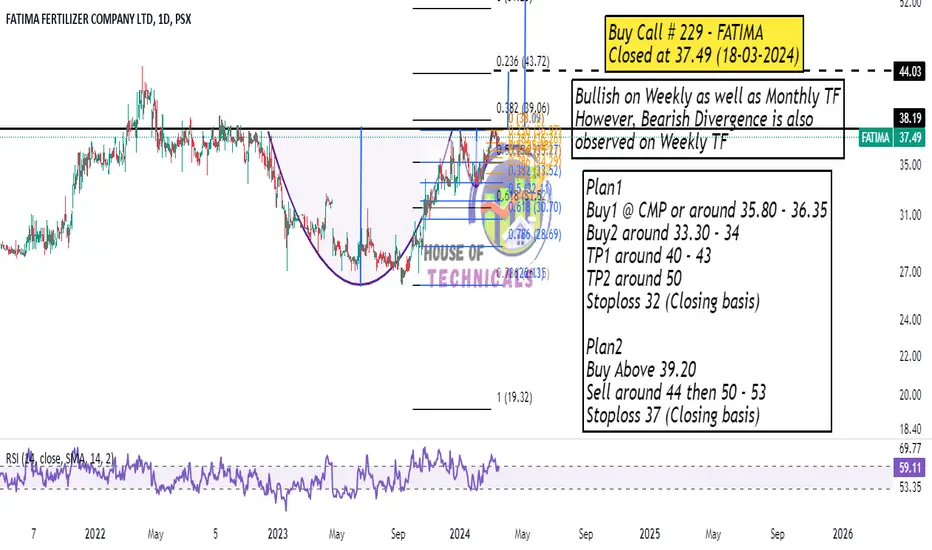
My Suggested Trade Values
Entry (BUY STOP): 74
Stop Loss: 61 (Lower than previous LL)
TP-1: 82.19
TP-2: 86.67

FATIMA, Bearish Divergence on Target Completion Cup and Handle
Breakout appeared
Cup and Handle projection almost complete
Bearish divergence developing
Trade with caution

FATIMA1. Price in up Trend
2. Forming Accending Channel
3. Price Multiple times test Resistance
4. Volume supported Price movement
5. Momentum is Positive
6. No Bearish Divergence
Risk Management | Discipline | Stop loss is your Friend

FATIMA FERTILIZER | Formation of Cup & Handle PatternThe Cup & Handle pattern in Fatima Fertilizer appears poised to materialize upon satisfying its critical levels. Initial resistance is anticipated at 55.60, serving as the initial target. Potential rejection at this level could indicate the formation of a double top pattern, prompting the need for price consolidation to form the handle of the pattern. A breakout above the neckline would signal further upward momentum, with subsequent targets at 57.94 and 59.99.

More Points for BullsBullish on Weekly as well as Monthly TF
However, Bearish Divergence is also
observed on Weekly TF


FATIMA Energy Regained. Another Rally.FATIMA is a fertilizer compony. From September 2023 it has been gaining the grounds and steadily moving upward. It touched the high of 33.70 in mid October.
Than started the process of retracement to the 0.38 level. In last two weeks it has shown considerable momentum. In current week volume has been very high which is another positive sign.
Icing on the cake is crossover of RSI to its moving average.
Aggressive buyers may buy at current level and cautious one may wait for the break of recent high i.e. above 33.70
Have a profitable trading.
