FCEPL trade ideas
Though Bearish Div. is there but..FCEPL Closed at 109.41 (23-05-2025)
Crossing 115 - 117 will lead it towards 125 - 130 atleast.
Important Support level is around 107 - 109 & then
103 - 104
Should not break 97 as of now; otherwise we may witness
further selling pressure.

Beautiful candle but Bearish Divergence is also there..
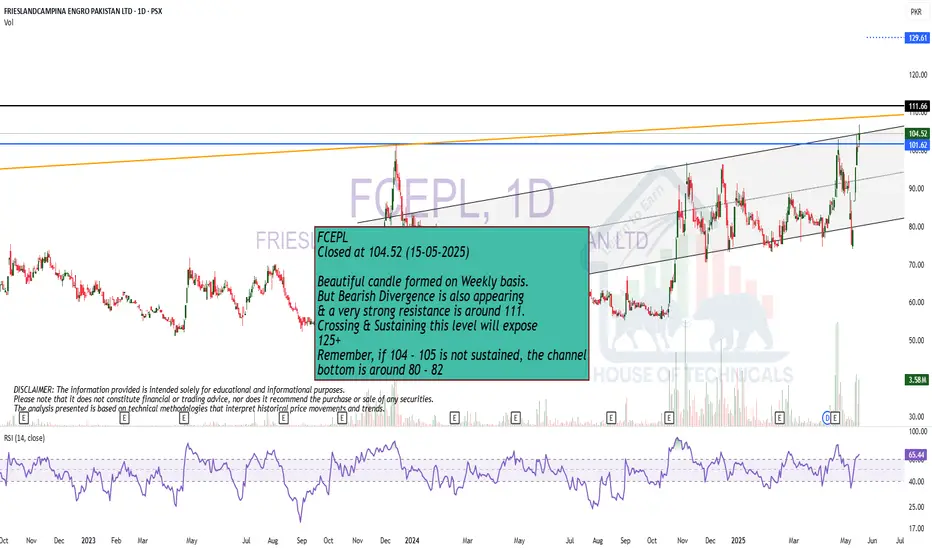
Beautiful candle formed on Weekly basis.
But Bearish Divergence is also appearing
& a very strong resistance is around 111.
Crossing & Sustaining this level will expose
125+
Remember, if 104 - 105 is not sustained, the channel
bottom is around 80 - 82
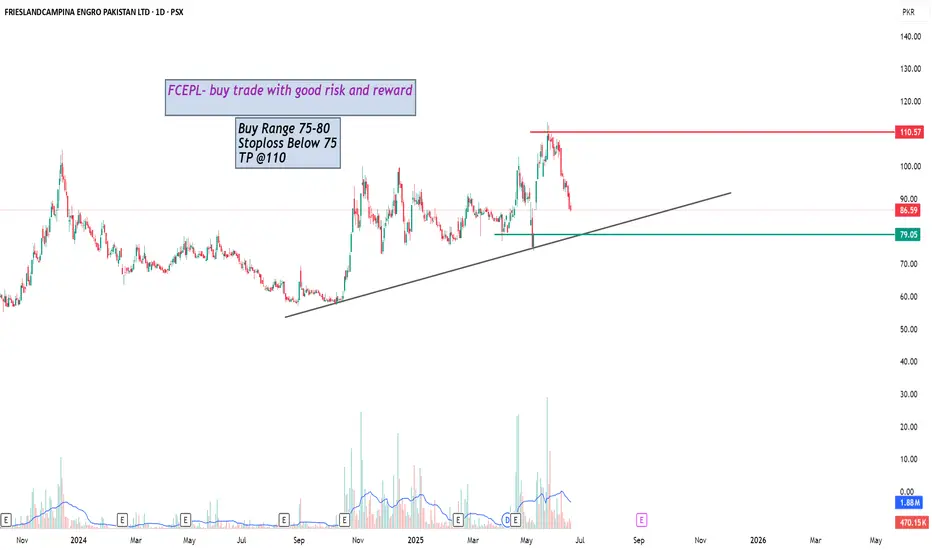
FCEPL LONG TRADEFCEPL is in re-accumulation phase of Wyckoff method with HL, HH and Spring happened successfully recently, it is expected to test and breakout of re-accumulation phase
BUY FCEPL 78-82
TP1 88
TP2 98
SL 72

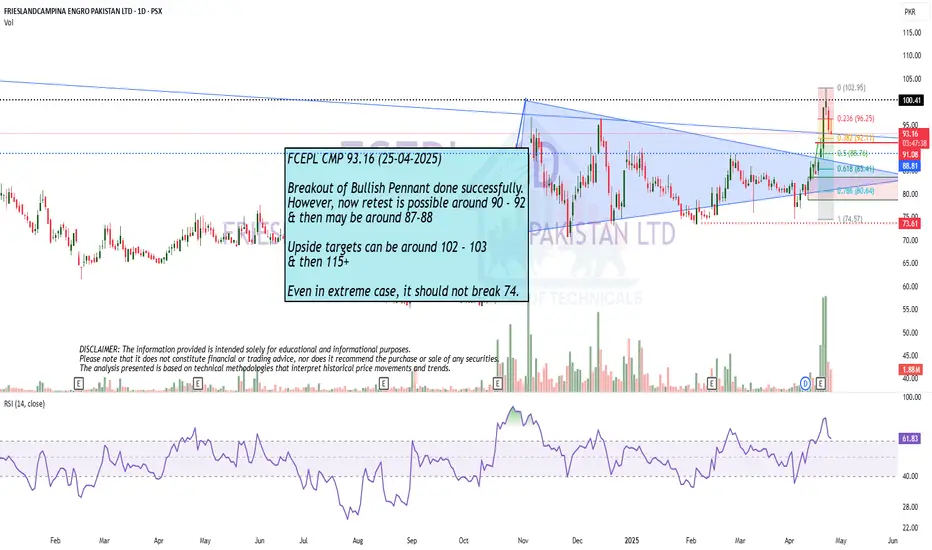
Breakout of Bullish Pennant done successfully.
Breakout of Bullish Pennant done successfully.
However, now retest is possible around 90 - 92
& then may be around 87-88
Upside targets can be around 102 - 103
& then 115+
Even in extreme case, it should not break 74.
Bullish Flag / Pennant Pattern Formation appearing.
Bullish Flag / Pennant Pattern Formation appearing.
87 - 88 is the Breakout Level; but Important Resistance
lies around 90 - 92
Closing above 100 - 101 would trigger more positivity.
Crossing & Sustaining this level may expose new Highs
around 130.
However, it should not Break 73.

FCEPL*The price action is forming an ascending triangle, which is generally a bullish continuation pattern.
*The RSI at the bottom shows market momentum and potential overbought/oversold conditions.
*Bullish Strategy: Buy after a breakout above 93 , with targets at 111 and 117.
*Bearish Scenario: If the price fails to break out and falls below 75
it could invalidate the bullish pattern, leading to further downside.

FCEPL in a range zoneFCEPL is trading in a range zone,currently price is at support and showing bullish signs,good oportinuity for buying at this level.

Long FCEPLThis share has a great potential and good for investors.
Last year's full-year earnings were Rs 1.93 per share. This year, after 3 quarters, the earnings is Rs 2.63 per share. This is the massive increase, and probably it beats Rs 3 per share after 4th quarter. That it will have an increase of around 40%.
Technically it has broken weekly EMA 200 resistance.
Retesting done at month level
Monthly trend line broken
All targets given through yellow lines

FCEPL-LONGFCEPL price reversed from last low and a good bullish candle has been formed,so we can enter at cmp with a strict stop loss

FCEPL Buying and Selling Zone (Currently at 82)These are buying and selling zones of FCEPL. Currently at 82.
Use SL as per your strategy
Note: This is not a buy/sell call.

FCEPL 82.65 and 94.51 are key levels for its flightThese both are key levels for its journey to above level of 100.
Note: This is not a buy or sell call.

FCEPLWeekly Support Retest
Bullish Divergence
Aiming for recent Highs
BUY above 68 upon closing
Final Target 107

FCEPL is BullishPrice was in a strong downtrend, however a matured bullish divergence led to the break of previous lower high, the bullish notion was further affirmed by the printing of a higher low. If bulls maintain pressure then we can expect a bullish reversal as per Dow theory. Targets are mentioned on the chart.

LongBeautifully taking Support from Monthly Trendline.
However, H&S Pattern is also formed on Weekly TF;
which is actually a reversal pattern.
But there is a Double Bullish Divergence on
Daily TF which is actually a Positive Trigger.
