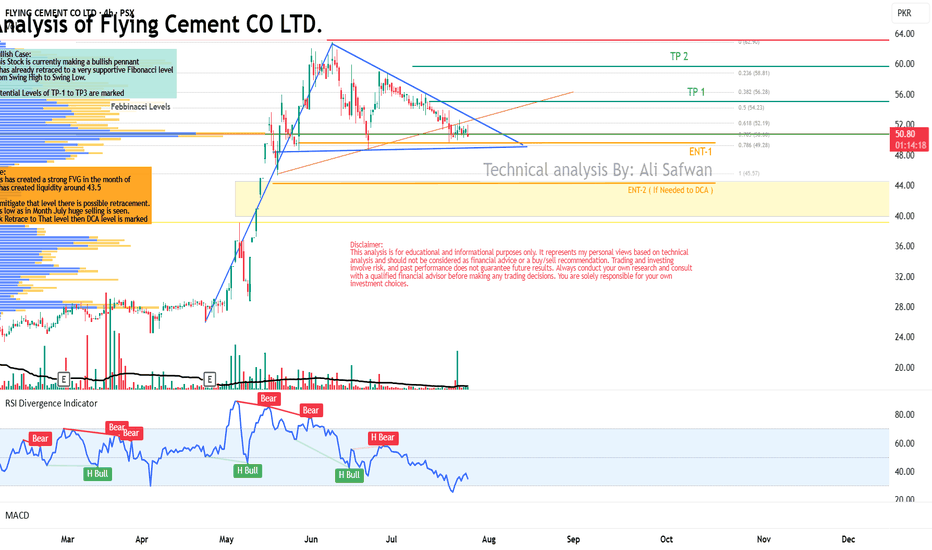
Technical Analysis of Flying Cement CO LTD.Bullish Case:
This Stock is currently making a bullish pennant
it has already retraced to a very supportive Fibonacci level
from Swing High to Swing Low.
Potential Levels of TP-1 to TP3 are marked
Bearish Case:
This Stock is has created a strong FVG in the month of
May which has created liquidity around 43.5
In order to mitigate that level there is possible retracement.
Possibility is low as in Month July huge selling is seen.
Incase Stock Retrace to That level then DCA level is marked
FLYNG trade ideas
FLYING LONG TRADEFLYING LONG TRADE
FLYING completed its Wyckoff Events and gave a breakout and successfully retested breakout. Post that, entered first wave/ Spike Phase and plotted Historical Highs. Now it is expected to trend in a channel phase, with slower momentum than before (expected) but still in uptrend making HHs and HLs. Also, it has started its third and final up leg. Volume Gradient is encouraging towards FLYING CEMENT up-move journey.
🚨 TECHNICAL BUY CALL –FLYING 🚨
BUY1: 59.9
BUY2: 57.5
BUY3: 54.1
📈 TP1 : Rs. 64.2
📈 TP2 : Rs. 69.77
📈 TP2 : Rs. 78.33
🛑 STOP LOSS: BELOW Rs. 46 (Daily Close)
📊 RISK-REWARD: 1:2.85
Caution: Close at least 50% position size at TP1 and then trail SL to avoid losing incurred profits in case of unforeseen market conditions.
PLEASE BOOST AND SHARE THE IDEA IF YOU FIND IT HELPFUL.
HH HL intact.FLYNG Closed at 50.80 (25-05-2025)
HH HL intact.
No Bearish Divergence yet on bigger tf.
54- 56 is the resistance for now.
If this level is crossed with Good Volumes,
we may witness further New Highs around 60+
On the flip side, 49 - 49.50 & then 47 - 47.50
may act as Good Support Levels.
However, breaking 45 will bring more Selling Pressure
towards 42 - 44
FLYNG - PSX - Technical Analysis for Sideways TradingOn 4h time frame, FLYNG was slipping down in a regression channel, continuously making LHs and LLs. Now it has broken out of the regression channel and moving upwards.
Seeing overall KSE-100 moving sideways, this SCRIPT is also expected to move in sideways.
So the trading strategy should be to buy on dip and sell on previous price resistance.
Trading values:
Buy-1 (CMP) : 27.26
Buy-2: 25.00
SL: 20.82
TP-1: 29.53
TP-2: 31.71
Flying cement breakout level for flying to 34.96 level26.62 is breakout level of Flying cement to fly to levels of 29.76 and 34.96 levels,
Today it was on lower lock and dropped 10% to level of 25.88. Iff tommorrow it again pick momentum and crosses level of 26.62 than it can fly to 29.76 and 34.96 level.
Note: Trade at your own risk.
FLYNG - SIGNIFICANT FALL IN PRICE EXPECTED (TODAY & ONWARDS) A two-day Volume comparison Analysis (03-09-24 & 04-09-24)
Today the Total Vol stood at 35.345M as compared to Yesterday's Total Vol which was 17.409M, an absolute increase of 17.936M and a %age increase of 103.03%.
In contrast to that, Yesterday's Delta Volume (closing figure), which is actually the difference of Buying MINUS Selling Volume was 14.237M as compared to Today's Delta Volume close figure of 4.900M.
Today's Delta Volume made a HIGH of 11.030M and then came down to and closed at 4.900M, a reduction of 6.130M i.e. a %age decrease of approx. 55% in the Buyers, today.
And when we compare todays Delta Vol figure with that of yesterday there is a significant decrease / drop in the Net Buyer-Sellers volume figure of around 9.144M (a %age decrease of 65&).
From this we can deduce that the NET Buyers-Sellers Volume is dropping at an increasing pace and today the selling volumes have eventually erupted in the Scrip.
It is worth noting that Indicators are still optimistic.
Daily RSI value is 79.96 and the weekly RSI value is 83.74.
Daily ADX value 46.86
+DI value 47.33
-DI value 11.20 quite BELOW the +DI value.
Relevant Snaps attached for ready reference.
FLYNG | Either BoS or CHoCH🚀 Stock Alert: FLYNG
📈 Investment View: Technically Bullish 📈
🔍 Quick Info:
📈 Buying Range : 9.15-9.20
🎯 First Target : 9.55
🎯 Second Target : 10.10
⚠ Stop Loss: 8.70
⏳ Nature of Trade: Short Term (Scalping)
📉 Risk Level: Medium
☪ Shariah Compliant: YES
💰 Dividend Paying: NO
📰 Technical View: On the 4 hour time frame, the price is making lower low after making a top of 10.13 which will act as resistance level of the price. Long position can be consider in a range of 9.15-9.20 with the stop loss if it breaks its previous low at 8.70. Initial target lies at 9.55 and second target around 10.10.


