GATM trade ideas
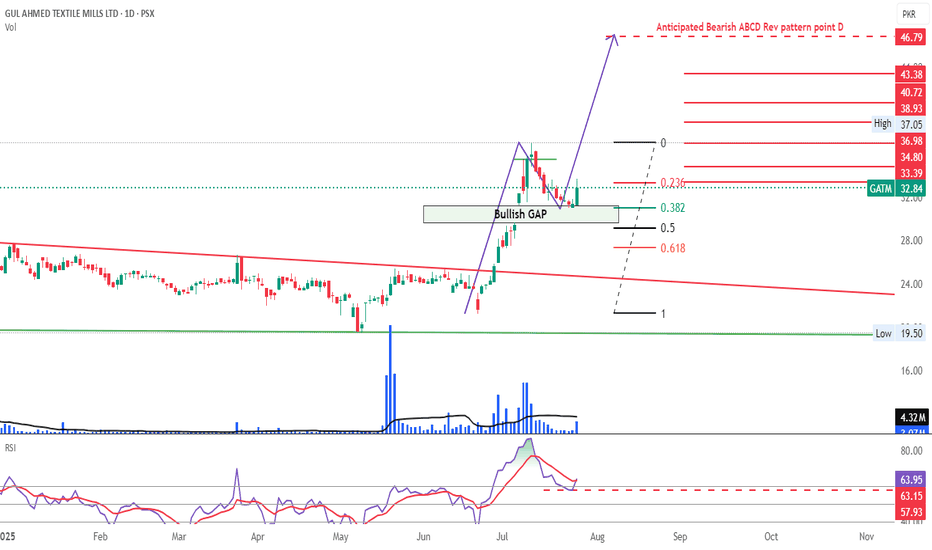
GATM LONG TRADE 09-07-2025GATM – LONG TRADE | 09 JULY 2025
Gul Ahmed Textile Mills Limited (GATM) has completed its previous uptrend leg and recently entered a healthy pullback, which now appears to be ending. With structure reset and bullish momentum building, the stock is poised to aim for extended quantified targets.
Recent technical analysis supports a strong buy rating, and the stock has already delivered a 57.03% return over the past year — positioning it as a high-potential opportunity.
📌 Execution Strategy:
Caution: Please buy in 2–3 parts within the buying range. Close at least 50% of your position at TP1 and trail the stop loss to protect gains in case of volatility.
📢 Disclaimer: Do not copy or redistribute signals without prior consent or proper credit to The Chart Alchemist (TCA).
✨ Kindly support our efforts by boosting and sharing this idea!
GATM Offers 30% upside on weekly chartAfter achieving TP1 of 25.05 and TP2 of 26.69, GATM is poised to make another stream of gains. This time 30% upside, if weekly closing is above previous High of 26.81, with SL @17.4 for Potential Target price of 35.71.
Since the trade is on weekly chart, it can simply take 2-3 months to achieve the Target.
GATM:- CONSOLIDATION MAY CONVERT IN TO BREAKOUTGATM is a prominent player in textile sector. It has been in consolidation since the start of 2024. Now it has formed a triangle. If the price close above the recent high i.e. 21.30 it is expected it shall also break above the triangle. In such scenario the TP shall be 26. SL is at 17.75.
Due diligence and strict money management is solicited.
Have a profitable trading.
GATM🚀 Stock Alert: *GATM*
📈 Investment View: Technically Bullish 📈
🔍 Quick Info:
📈 Entry Range: 20-20.50
🎯 First Targets : 21.50
🎯 Second Targets : 23.00
⚠ Stop Loss: 18.80
⏳ Nature of Trade: Short Term (Scalping)
📉 Risk Level: Medium
☪ Shariah Compliant: NO
💰 Dividend Paying: YES
📰 Technical View: Following a rebound from the support level of 19, the price is presently trading around 20, indicating a potential accumulation phase. Initial resistance is anticipated at 21.50, with a secondary resistance at 23. To manage risk, it is advisable to set a stop loss below the previous low, approximately around 18.80.
GATM Flag PatternPossible pull back is expected according to flag pattern observed in 15 minutes time frame. Rejection towards lower channel can be seen in the price. Wait and watch for the pull back for new entry around 21.85. Break out of the flag can pull the price towards 23 level (resistance area). On the flip side, if it breaks downward and sustains 21.50 level then exit from the trade because it can go further down.
GATM We are Witnessing a Breakout Gul Ahmed Textile Mills Ltd. is a prominent plays in textile sector.
It posted a high price of 21.40 in the last days of May 2023. Afterwards the prices have been declining. From the middle of September it started gaining the momentum.
Start of November witnessed sharp rise in the price and intraday breach of previous high. After few days it crossed over the same hurdle but with more zeal. Albeit it couldn't sustain the closing above but the healthy volume suggest it is a matter of time only.
We believe this time we may see a hyper move in the price.
Have a profitable trading.


