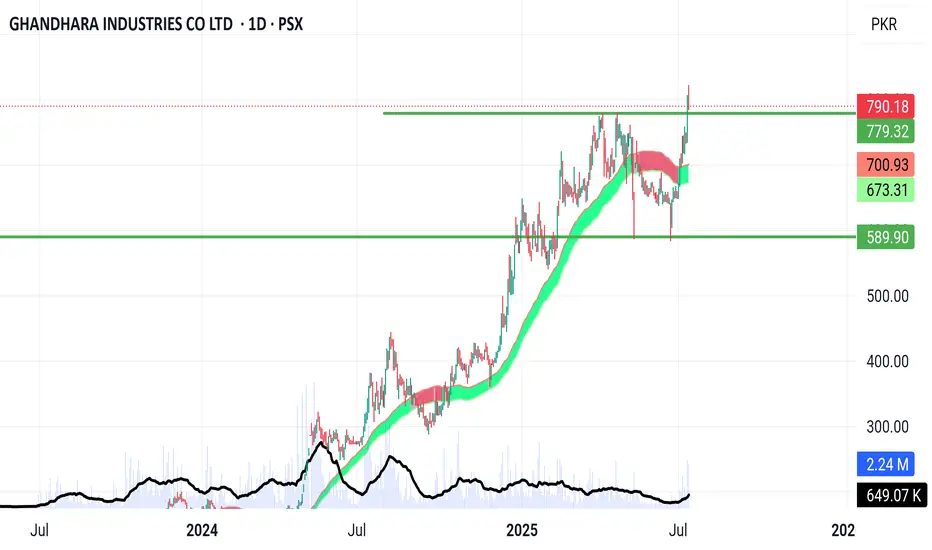
GHNI, buy on Retest LevelReasons include :
1. Breakout and retest of ATH level
2. Surge in volume to
3.RBS area
4. Strong Fundamentals
Profit targets are 850,900 and 1,100
80.04 PKR
781.41 M PKR
14.67 B PKR
11.90 M
About GHANDHARA INDUSTRIES CO LTD
Sector
Industry
CEO
Ahmad Kuli Khan Khattak
Website
Headquarters
Karachi
Founded
1963
ISIN
PK0007101014
FIGI
BBG000NVQPN6
Ghandhara Industries Ltd. engages in the manufacture and market of vehicles. Its products include pickup, trucks, and buses. The company was founded by M. Habibullah Khan Khattak on February 23, 1963, and is headquartered in Karachi, Pakistan.
Related stocks
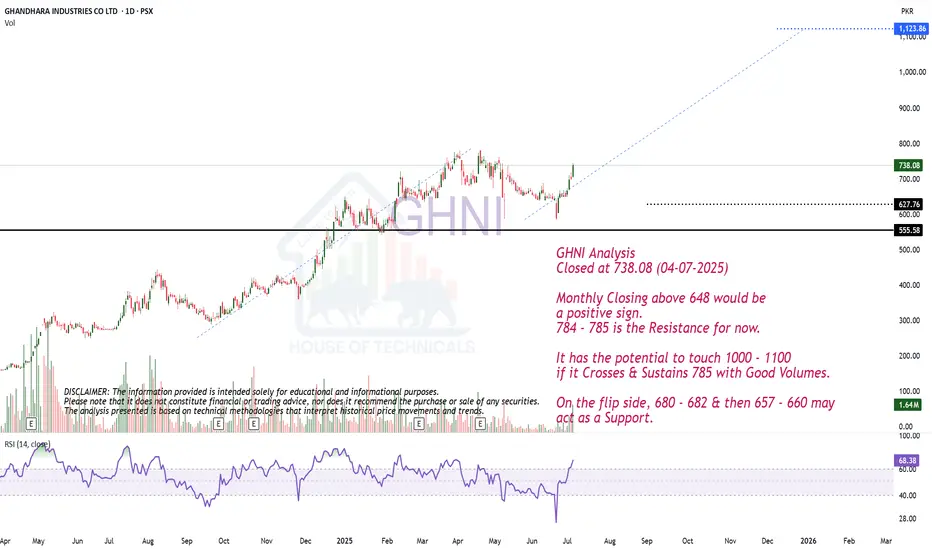
ABCD PatternGHNI Analysis
Closed at 738.08 (04-07-2025)
Monthly Closing above 648 would be
a positive sign.
784 - 785 is the Resistance for now.
It has the potential to touch 1000 - 1100
if it Crosses & Sustains 785 with Good Volumes.
On the flip side, 680 - 682 & then 657 - 660 may
act as a Support.
Very Good Weekly Closing.
Very Good Weekly Closing.
Monthly Closing above 780 is Important,
otherwise, Tweezer Top is Expected which
is a Negative sign.
Channel Top is around 825 - 830.
Initial Support seems around 700 - 705.
& Double Bottom (in case of Selling Pressure)
is around 640 - 645 (which may also act as Support)

GHNI BUY IDEA.AS per the Elliot wave theory we are in the 5th leg which is targeting 950 rs.
As of the current scenario , we are trading in a bullish parrallel channel.
with Hidden divergence formed + emas merging on this point we can expect a good bull move from 710-720 rs , targeting abv highs.
A bullish candle

GHNI Next BULLISH MOVEHistorical Trend: Strong bullish momentum observed.
Current Situation: Price dropped after a clear bearish divergence signal.
Stock Status: Still in an overall bullish structure.
Next Step: Divergence has already occurred ....... preparing to ride the next bullish move.

GHNI - CONTINUES TO B UPWARD, IS IT HEADING FOR 1000+ ???
Current Price: 764.04
Chart Setup: Uptrend within an Ascending Channel
Ghandhara Industries Ltd. (GHNI) has been experiencing a strong bullish trend, moving within an ascending channel over the past year. The stock has shown significant upward momentum, consistently bouncing between the support a

GHNIGHNI Analysis
Currently moving in a box need to break 705 then can go up to touch 730
Bearish Divergence formed in Daily/Weekly

Monthly Closing is ImportantGHNI has successfully completed its Weekly
ABCD Pattern around 590 - 595.
However, there is No Bearish Divergence Yet on
Bigger Time Frames.
Monthly Closing above 592 - 595 would be a
Positive Sign.
However, it should retrace upto 540 - 550
once for a Good Upside Rally again.
Breaking 500 may bring

GHNI trading Since Rs 167 - Long New targetI have been working on GHNI since Rs 167 and my final target was Rs 600 which was acheived last month. Now after consolidation, GHNI is read for a new target of Rs 825.
This is the first target, not the last one.

GHNI-BULLISH FLAGThat stock is moving in three patterns but in my vision its break its resistance and carry forward its upward momentum in future.

See all ideas
Summarizing what the indicators are suggesting.
Oscillators
Neutral
SellBuy
Strong sellStrong buy
Strong sellSellNeutralBuyStrong buy
Oscillators
Neutral
SellBuy
Strong sellStrong buy
Strong sellSellNeutralBuyStrong buy
Summary
Neutral
SellBuy
Strong sellStrong buy
Strong sellSellNeutralBuyStrong buy
Summary
Neutral
SellBuy
Strong sellStrong buy
Strong sellSellNeutralBuyStrong buy
Summary
Neutral
SellBuy
Strong sellStrong buy
Strong sellSellNeutralBuyStrong buy
Moving Averages
Neutral
SellBuy
Strong sellStrong buy
Strong sellSellNeutralBuyStrong buy
Moving Averages
Neutral
SellBuy
Strong sellStrong buy
Strong sellSellNeutralBuyStrong buy
Displays a symbol's price movements over previous years to identify recurring trends.
Frequently Asked Questions
The current price of GHNI is 818.12 PKR — it has increased by 1.81% in the past 24 hours. Watch GHANDHARA INDUSTRIES CO LTD stock price performance more closely on the chart.
Depending on the exchange, the stock ticker may vary. For instance, on PSX exchange GHANDHARA INDUSTRIES CO LTD stocks are traded under the ticker GHNI.
GHNI stock has risen by 5.56% compared to the previous week, the month change is a 26.35% rise, over the last year GHANDHARA INDUSTRIES CO LTD has showed a 134.08% increase.
GHNI reached its all-time high on Jul 11, 2025 with the price of 821.97 PKR, and its all-time low was 3.20 PKR and was reached on Jan 4, 2013. View more price dynamics on GHNI chart.
See other stocks reaching their highest and lowest prices.
See other stocks reaching their highest and lowest prices.
GHNI stock is 3.13% volatile and has beta coefficient of 1.01. Track GHANDHARA INDUSTRIES CO LTD stock price on the chart and check out the list of the most volatile stocks — is GHANDHARA INDUSTRIES CO LTD there?
Today GHANDHARA INDUSTRIES CO LTD has the market capitalization of 34.86 B, it has decreased by −3.64% over the last week.
Yes, you can track GHANDHARA INDUSTRIES CO LTD financials in yearly and quarterly reports right on TradingView.
GHNI net income for the last quarter is 1.64 B PKR, while the quarter before that showed 657.65 M PKR of net income which accounts for 148.69% change. Track more GHANDHARA INDUSTRIES CO LTD financial stats to get the full picture.
GHANDHARA INDUSTRIES CO LTD dividend yield was 0.00% in 2024, and payout ratio reached 0.00%. The year before the numbers were 0.00% and 0.00% correspondingly. See high-dividend stocks and find more opportunities for your portfolio.
As of Jul 26, 2025, the company has 579 employees. See our rating of the largest employees — is GHANDHARA INDUSTRIES CO LTD on this list?
EBITDA measures a company's operating performance, its growth signifies an improvement in the efficiency of a company. GHANDHARA INDUSTRIES CO LTD EBITDA is 4.61 B PKR, and current EBITDA margin is 10.55%. See more stats in GHANDHARA INDUSTRIES CO LTD financial statements.
Like other stocks, GHNI shares are traded on stock exchanges, e.g. Nasdaq, Nyse, Euronext, and the easiest way to buy them is through an online stock broker. To do this, you need to open an account and follow a broker's procedures, then start trading. You can trade GHANDHARA INDUSTRIES CO LTD stock right from TradingView charts — choose your broker and connect to your account.
Investing in stocks requires a comprehensive research: you should carefully study all the available data, e.g. company's financials, related news, and its technical analysis. So GHANDHARA INDUSTRIES CO LTD technincal analysis shows the strong buy rating today, and its 1 week rating is strong buy. Since market conditions are prone to changes, it's worth looking a bit further into the future — according to the 1 month rating GHANDHARA INDUSTRIES CO LTD stock shows the strong buy signal. See more of GHANDHARA INDUSTRIES CO LTD technicals for a more comprehensive analysis.
If you're still not sure, try looking for inspiration in our curated watchlists.
If you're still not sure, try looking for inspiration in our curated watchlists.