GWLC (Ohh I hate Resistances)GWLC is facing some trend line resistance shown in chart. Next expected resistance is also shown (~58.90).
Breaking it will move it up towards all time high (70).
Its my personal opinion, not a buy/sell call.
GWLC trade ideas


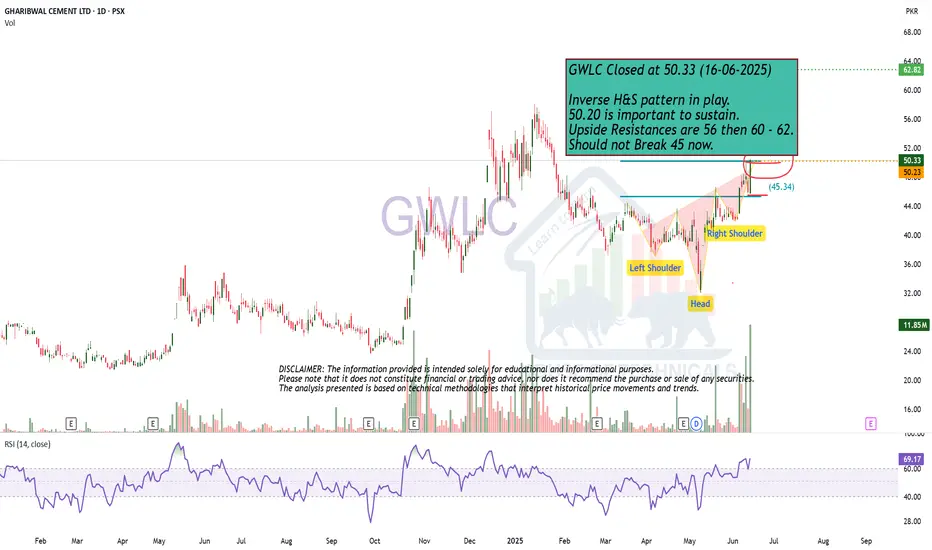
Inverse H&S pattern in play.GWLC Closed at 50.33 (16-06-2025)
Inverse H&S pattern in play.
50.20 is important to sustain.
Upside Resistances are 56 then 60 - 62.
Should not Break 45 now.
GWLC - About to have a breakoutGWLC tried to break its previous high but failed last time. Its again retesting it and hopefully will give breakout this time (48.35).
Then it may go to retest its all-time high (70). Ultimate target can be 132.
This is not a buy/sell call, just my own opinion.

Monthly closing above 43.10 would be a positive sign. GWLC-Closed at 42.95 (27-05-2025)
Monthly closing above 43.10 would be a
positive sign.
Weekly Closing should be above 42.
a Bullish Inverse H&S pattern is formed & it
would be valid only if 40.60 is not broken.
Upside targets (if 44.80 is Crossed), can be 50+

GWLC - PSX - SWING Trading Technical Analysis - Harmonic PatternOn Monthly TF, two harmonic patterns have been drawn. Gartley (94% complying) and Butterfly (88% complying).
In this bull run prices are moving way to fast. And due to market sentiments Bulls are in control. In normal bull run Gartley pattern will be complied before price drops but chances are that price will make new All Time High and follow Butterfly.
RSI is around 80 without any sign of reversal; however, minor retracements are normal but overall price will stay in up trend.
LONG Buy Trade Call
Buy-1 : 50.78
Buy-2 : 61.00
SL: 39.00
TP1: 57
TP2: 78

GWLC is in Bullish ZoneGWLC is now above bearish zone and may be it will cross 45.3, 47.44 and 49.4 levels.
Stop loss 38.75
Note: This is not a buy/sell call.

Will Head & Shoulder Pattern play or not?Monthly Closing above 42 would be a
positive sign.
Weekly closing above 41.80 may lead
it towards 45.
H&S pattern is somewhat worrying. So,
unless 45-45.50 is crossed & Sustained, we
cannot expect further upside.

Is the Dow Theory Still in Play?First of all what is Dow Theory?
According to Dow Theory, it's all about Higher Highs (HH) and Higher Lows (HL) or Lower Highs (LH) & Lower Lows (LL). These the building blocks of an uptrend or downtrend respectively: (You can further google it) Together, a series of HHs and HLs suggests that the market's upward momentum is intact.
Now Let’s take a look at the weekly chart:
Previously, The market was locked in a downtrend, consistently making Lower Lows and Lower Highs. But the pattern broke when the price could not broke the previous low (LL) of 14.42 (closing basis) and formed a new high at 19.45 (Breached Previous HL). Since then, the sequence of HHs and HLs started, with the latest Higher Low at 24.36. As long as the price respects this pattern, the uptrend remains intact.
However, there are challenges ahead. Athough, the EMA 89 (Fib) is offering support on the weekly chart, but a significant trendline resistance is there on both the weekly and monthly timeframes (marked in red) which is lower there on the graph from the previous HH. Breaking this resistance and the previous Higher High (HH) will be a little bit crucial, but a retest of the trendline may occur if the breakout is successful.
Note: I’m also a learner and open to suggestions. If you spot any errors or gaps in my analysis, feel free to share your thoughts. Thanks!

GWLC is ready to flyGWLC is heading to 60 and 75
after breaking level of 50.
Currently at 42.31
Note: This is not a buy/sell call
Use stop loss whenever trade
Boost and follow me for more
updates.

GWLC - PSX - Buy OpportunityGWLC has been on an upward trend for a long time. It is going to make a deeper correction after a bearish divergence at the weekly time frame. Look for the buy opportunity at marked levels.

GWLC - Monthly Technical Analysis - Buy CallPresently it is in Bull run but the momentum is lesser than previous bull run. Killinger Oscillator suggests that at the moment Bulls are in control. The price has always respected Bollinger's Band upper limit and has always retraced back to center line. Based on previous 15 months bull run, it is expected that it will touch Rs 43.45 in February 2025. Therefore, gains of 30% in 4 months is on the cards.
Parallel channel has also been drawn and it is expected that price will stay in the channel. However, if price breaks the channel before January, 2025 then it may go even further up sharply to retest its all time high of Rs 70.
LONG Buy Trade Call
Entry: 30.22
SL: 24.85
TP1: 43.45
TP2: 48.00

Bullish on Daily TF.
But Not Yet Bullish on Bigger TF.
Crossing & Sustaining 31.50 may lead it
towards 35 - 37.
However 45 - 47 is an Important Resistance Zone.

GWLC ANALYSIS 3.0
🚀 Trade Alert Update: GWLC Bullish Flag & ABCD Pattern 🚀
Previous Trade Update:
TP 1: Triggered at 35.00 🥇
TP 2: Still in progress 📊
Current Market Condition:
GWLC has faced some pressure and declined along with the market, undergoing a good correction. The ABCD pattern remains valid.
Technical Indicators:
Horizontal Support Line: The price is currently at a horizontal support line, offering a new buying opportunity.
Entry Point:
Buy: At 28.50
Target Prices (TP):
TP 1: 31.00 📈
TP 2: 35.00 🥈
Stop Loss (SL):
SL: 26.00 to manage risk
Trade Summary:
Buy: At 28.50
TP 1: 31.00
TP 2: 35.00
SL: 26.00
Trade Type: Long Swing 🎢
Good Luck! 🍀
Stay informed and trade smart! 📊

GWLC Analysis 2.0.We have identified a promising bullish setup in GWLC, highlighted by the following patterns:
Bullish Flag Pattern 🚩
ABCD Pattern 📈
Technical Indicators:
No divergence is present, validating the Bullish Flag pattern.
Entry Point:
Consider buying in the range of 29-30.
Target Prices (TP):
TP 1: 34.91 🥇
TP 2: 39.91 🥈
Stop Loss (SL):
Place your stop loss at 26.30 to manage risk.
Trade Summary:
Buy Range: 29-30
TP 1: 34.91
TP 2: 39.91
SL: 26.30
Trade Type: Long Swing 🎢
Good Luck! 🍀
Stay informed and trade smart! 📊

GWLC - ABCD pattern - BuyPSX:GWLC making ABCD pattern and breaking out of Ascending triangle. Buy at CMP with SL below previous HL. TP at 1:1 and 1:2 ratio defined

GWLCAfter the major correction is over, a new impulse move develops. The next 5-up wave pattern has already taken place. We can look for certain levels though where the probability is higher for a wave to end. These are just projections and are not meant to predict the future. First and second resistance levels are 30.80 and 34.67 respectively. Risk is defined below 25.

PSX - GWLC OutlookGWLC has given breakout from accumulation zone and has retrace from FIB@38 after the making higher high. recommended entry point based current index pressure @27.70
Entry:27.70
StopLoss:23.20
TP1:32.20
TP2:36.70
