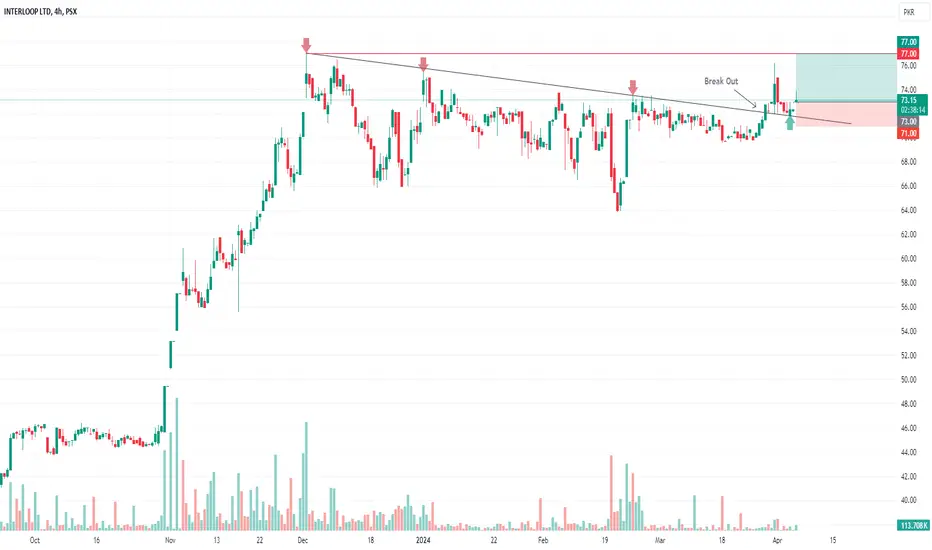
InterloopILP Short term analysis 4th April 2024
Buy at 73 with strict stop loss of 71 and profit targets at 77.
TECH NOTE: ILP break out and retest from its trend line is observed on 4 hour chart. This pattern is bullish for its price action. Use stop loss if breaks 71 and do profit taking around 77.
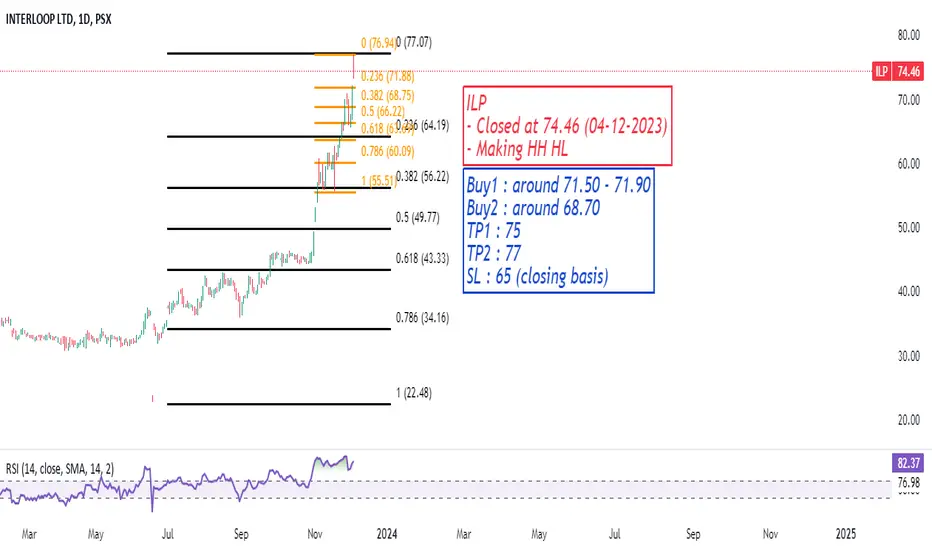
ILP trade ideas
PSX: ILP (Interloop Ltd), BULLISH Trade Idea: Long Position in Interloop Limited (ILP)
1. Context and Overview:
Stock: Interloop Limited (ILP)
Technical Analysis Approach: We’ll examine key price levels, patterns, and recent changes in character.
2. Technical Analysis:
FVG (Fair Value Gap) Region:
The price is currently tapping into the FVG region, which spans from 69.71 to 71.18.
FVG acts as potential support, suggesting a bounce-back opportunity.
Order Block (OB) Region:
The price is entering the OB region, ranging from 66.77 to 71.19.
OB regions often indicate significant accumulation or distribution.
Change of Character (CHoCH):
Recent price behavior shows a potential change in character.
If the price bounces back, it could signal a bullish reversal.
3. Trade Setup:
Entry Point: Look for confirmation of price bouncing back within the OB region.
Profit Target: Aim for a price target of 77.
Note: This level is considered weak high levels, so monitor closely.
Stop Loss (SL): Set SL at 71.2 (critical accumulation point).
4. Rationale:
The combination of FVG support, OB entry, and CHoCH suggests a favorable setup.
The next earnings announcement on Wed, May 9, 2024, could drive price movement.
5. Conclusion:
Consider a long trade in ILP if conditions align.
Monitor price action and adjust your position as needed.
Remember to manage risk and stay informed about market developments. Happy trading! 📈🔍

ILP - AccumulationILP is in accumulation phase on 1hour chart, it might go towards its first resistance in the coming days. but if it breaks the supports then it might fall more below.

ILP (Interloop) PSX bullish flag pattern on W1 candle ILP is bullish and has formed bullish flag pattern on W1 candle. . The stock is predicted to touch Rs. 210 in the next move. Recommended for medium term, 3 to 6 month investment strategy.


ILP is BullishILP is experiencing strong bullish momentum and has successfully sustained previous higher low. This means that there is still room for upward movement. A breakout above previous higher high would confirm a bullish move. Targets are mentioned on the chart.

ILP is BullishILP is currently in a strong bullish momentum, it has not broken its previous higher low and has reversed from slightly above it. This indicates that there is still ample room for upward movement. According to AB=CD projection, target price for this rally is around 90. Entry and Take Profit points are mentioned on the chart.

ILP is BullishILP is in a strong upward momentum, printing new higher highs and higher lows consistently, and hence the bullish rally is expected to continue to an all time high. Targets are mentioned on the chart.


ILP to continue its Bullish RallyILP is consistently making higher highs and higher lows and the trend is expected to continue after the formation of a bullish hammer candle on daily time frame.
