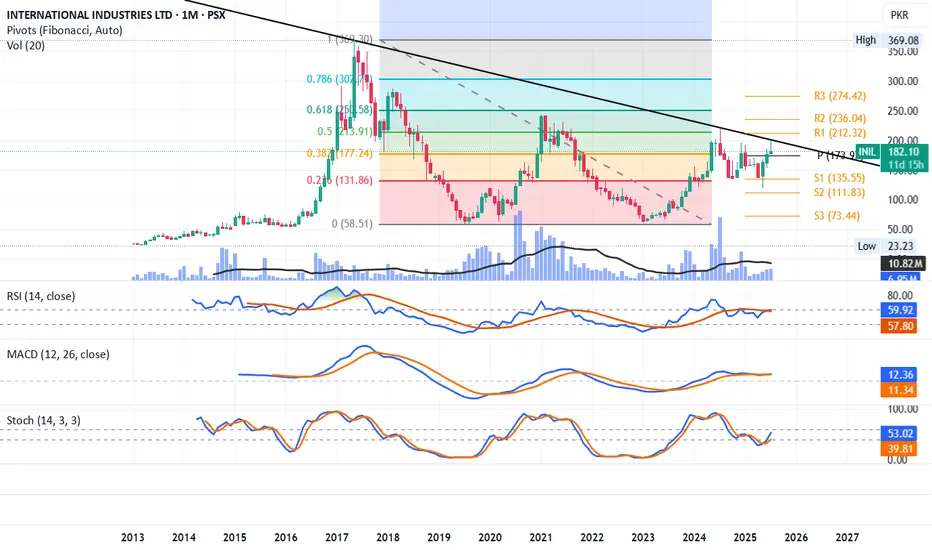
INIL LongRSI, MACD and Stoch, all are giving buy signal.
INIL has tested its monthly support 1 twice, forming a small W which is a bullish pattern.
It is trending above its monthly pivot (174).
Currently, the trendline is stopping it and breaking it will not only make it retest its R1 (212) but also 250 (R2) soon.
Volumes are not supporting though but once it breaks the trendline, we may witness volumes as well.
Its my personal opinion, not a buy / sell call.
INIL trade ideas
Inverse H & S Possible..INIL Analysis
Closed at 164.41 (29-05-2025)
Bullish on Daily TF.
Weekly Closing above 155 - 156
is a good sign.
However, 169 - 170 is an Important
Resistance zone.

LONG INILLonged INIL. Bought spot shares. Broken out of range. Should take a while to play out as I am trading mostly on weekly and monthly charts. Entry, Stop Loss and Exit all there. Worth a punt!
Will update in due time as we go forward.
Manage your risk! #DYOR

PSX: INIL Outlook INIL about the complete the consolidation phase and breakout confirm will start from channel breakout by sustaining above 164 level then breakout with strong candle 172 level for further confirmation.
Entry : 172
TP1: 190
TP2: 208
TP3: 226

Important Support level159 - 163 would be a Very Good Support Level
as this Support is of Monthly TF. So Patient Traders /
Investors may wait for this level; which seems bit
difficult (as of now) due to Bullish Divergence on
Shorter TF.
180 - 185 is an Important Resistance.

Wait for a Good Support LevelIt beautifully completed ABCD pattern around
219 - 220 and then reversed.
Now the immediate Support seems to be around
122 - 123; from where it may start making the
Right Shoulder (may be up to 160 - 170) of H&S pattern.
However, next important Support is around 95 - 100.


INILAre you ready to seize a promising trading opportunity? INIL pulled back from 100-day EMA, this level is 50% Fib retracement also. Possible pull back from this level can be anticipated. As the pattern unfolds, the first resistance level to watch is around 183.61, with a potential surge targeting 203 and then 222. To manage risk, set your stop loss at 165. This well-defined setup offers a structured approach to capitalize on NIL's potential upside while protecting your investment.
Key Points:
Entry Point: Around 180.50-181.
Resistance Levels:
Initial resistance around 183.61.
First target after the breakout at 203.
Ultimate target at 222.
Stop Loss: Set at 165 to manage risk.

Important to Sustain 139Plan1
If 139 is Sustained, Entry can be taken then,
Otherwise
Buy around 134.55 - 136
Sell around 140 then 143
Stoploss 129 (Closing basis)
Buy above 156
Sell around 165
if 170 is Sustained, Next TP would be
around 180 -185
Stoploss 150 (Closing basis)

PSX KSE 100 INTERNATIONAL INDISTRIES INIL1- Breakup of weekly Trend
2- Volume Increasing day by day
3- Fibonacci retracement also done
4- Hopefully it will get Target
5- Facing resistance at 143.28 and completing Support at 0.382 at 141.05 is again moving up
6- trend is UP
7- Stosch RSI indicator is also generated a buy signal.

PSX -INIL OutlookINIL is in bullish trend by making higher high and breakout the last HH by generating volume. weekly trend also reflect potentials of Long trade targeting 173 @0.618 Fib level
Entry:125.50
StopLoss:111.50
TP1:139
TP2:153
