Important Resistance !ISL
Closed at 97.96 (18-07-2025)
Important Resistance is around 98 - 104.
Once crossed with Good Volumes, we may
witness upside move towards 130 & then
around 150.
On the flip side, 94 - 96 & then around 80 - 83
are the Important Support Levels.
ISL trade ideas

ISL LongCurrently Fib 0.5 of its all-time high and its last peak - both are showing resistance.
Once it breaks the level, the trendline will act as resistance (~114).
After that it may speed-up towards its next targets of 121, 146 and previous all-time high.

H & S Pattern on Bigger tf.ISL Analysis
Closed at 97.65 (04-07-2025)
H & S Pattern on Bigger tf.
Very Important to Sustain 99 - 100.
Sustaining this level may lead it
towards further upside around 105 - 109
initially.
Otherwise it may test 85 - 87.

ISL Buying StrategyHere's a breakdown of the trading strategy for ISL stock:
Trading Strategy:
- *Breakout Confirmation:* Successful breakout above a certain level (not specified)
- *Buying Strategy:*
- Buy around: Rs. 81-77
- Stop Loss: Rs. 73
- *Targets:*
- 1st Target: Rs. 87
- 2nd Target: Rs. 100
- *Further Action:*
- Hold the stock if it sustains above Rs. 100
- Use trailing stop loss to lock in profits
Key Considerations:
- *Risk Management:* Setting a stop loss at Rs. 73 limits potential losses
- *Profit Booking:* Targets at Rs. 87 and Rs. 100 provide clear profit-booking levels
- *Trailing Stop Loss:* Adjusting the stop loss as the stock price moves up can help lock in profit

PSX: ISL OutlookISL is taking support from weekly channel for new bullish trend. Expecting positive monthly closing
Entry: CMP
SL: 160
TP1: 86
TP2: 102
TP3:128
harmonic pattern TP 160 Level

ISLCurrent Price: The stock is currently trading at 78.06
Safe Entry Point: A safe entry for a swing trade is suggested after 89-90
*Head and Shoulders Pattern:
If the price breaks below the current level and fails to show strength, it could drop further toward the Head & Shoulders target of 60.85
A downward movement (red arrow) represents this bearish scenario.
*Bullish Scenario:
If the stock shows positive signs (such as increased volume, breakout confirmation), it could bounce back up.
A breakout above 89-90 could push the price towards 101.21


ISL-MonthlyOn the monthly chart 102, the bullish channel top and horizontal resistance confluence are at the top. Closing above will unfold the next levels

ISL - Long positionSort of a cup and handle pattern formed.
First Target is Rs 105
Pattern Target is Rs 113-117.
Steel sector is not a great sector from an investment point of view considering the nature of the business; however, in a bull market, you can expect great results.

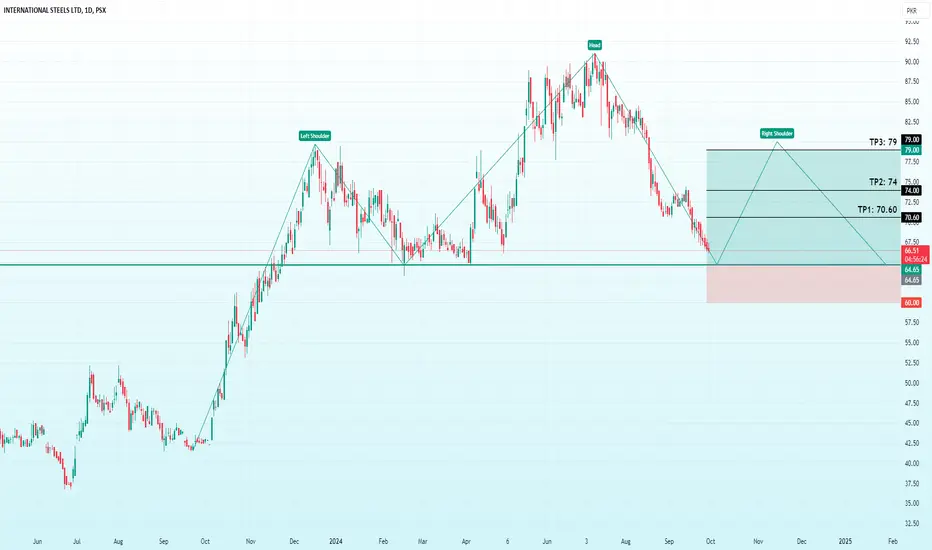
ISL | Head & Shoulder PatternThe pattern identified is a "Head and Shoulders" formation, which typically signals a bearish reversal. The left shoulder and the head have already been formed, and the right shoulder is now in the process of forming. A long position can be considered during the formation of the right shoulder, indicating the possible completion of the pattern. The chart outlines three potential take-profit levels (TP1: 70.60, TP2: 74, and TP3: 79), suggesting a possible retracement before the price continues its movement. The relatively low volume could impact the strength of future price movements. Use stop loss at 60 to manage risk.
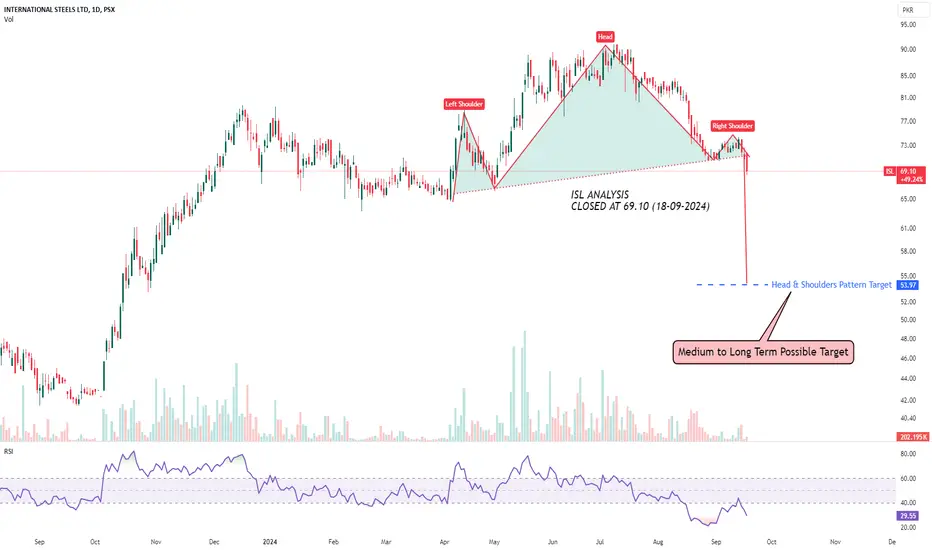
H&S Pattern in playMedium to Long Term Possible Target.
It needs to break & Sustain the Previous LH for Trend Reversal; otherwise H&S Target pattern is around 53.
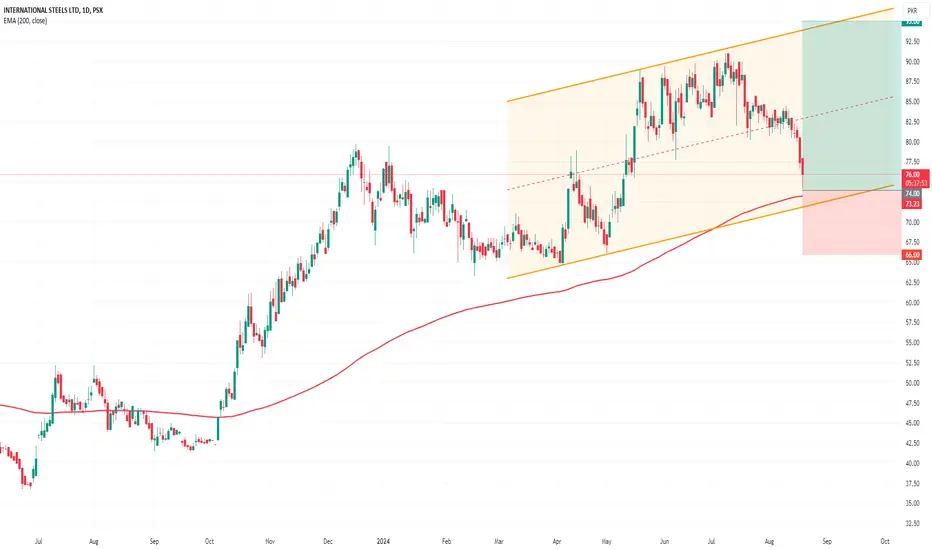
ISL | Parallel ChannelISL is currently trading within a parallel channel, as illustrated on the accompanying chart. The price has demonstrated a tendency to reverse upon testing either side of the channel. At present, the price is approaching the lower boundary of the channel, approximately at 74, which also aligns with the 200-day Exponential Moving Average (EMA). Several indicators suggest that a bullish reversal may be imminent, presenting a significant buying opportunity.
The initial target for this trade is set at 70.70, where previous rejection has been observed. Should the price break and sustain above this level, the next target is approximately 89.80. Furthermore, the upper boundary of the channel is around 95, which represents a potential swing trade setup requiring additional confirmation to achieve this target.
A stop loss should be placed at 66, marking a break below the channel. Please manage your trade accordingly.
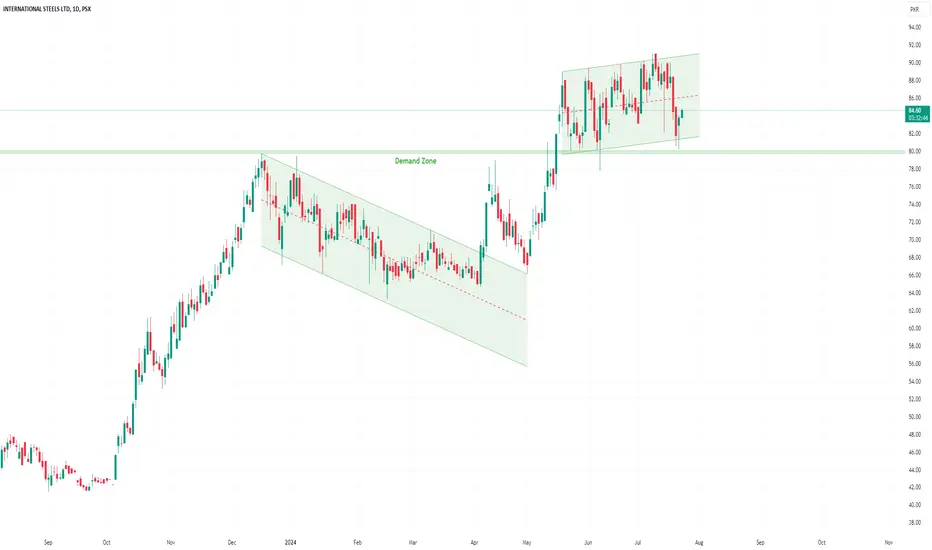
ISL | Parallel ChannelISL pulled back from parallel channel support. Initial resistance lies around 86.80 and upon sustaining resistance next lies around 90.
ISL ANALYSIS 2.0🚀 Trade Alert: ISL Uptrend with Sideways Consolidation 🚀
We have identified a bullish setup in ISL, characterized by the following:
Uptrend: ISL is in an established uptrend.
Sideways Movement: Currently in a sideways consolidation phase.
No Divergence: No bearish divergence spotted, indicating the likelihood of upward movement.
Current Situation:
Resistance Zone: Facing resistance in the zone of 89-91.
Potential Breakout: After crossing this resistance, the stock is expected to move towards higher targets.
Entry Points:
Buy: After crossing 91
Buy on Dip: At 84
Target Prices (TP):
After Crossing 91:
TP 1: 100.00 🥇
TP 2: 110.00 🥈
Buy on Dip at 84:
TP: 96.00 📈
Stop Loss (SL):
SL: 78.00 to manage risk
Trade Summary:
Buy: After crossing 91 or on dip at 84
TP 1 (After crossing 91): 100.00
TP 2 (After crossing 91): 110.00
TP (Buy on dip at 84): 96.00
SL: 78.00
Trade Type: Long Swing 🎢
Good Luck! 🍀
Stay informed and trade smart! 📊

ISLWe can attempt to buy ISL from specified level as 0.382 FIB also intact , also there is no bearish divergence at current levels.
SL , TP mention in chart

International Steels LimitedThe price is moving in a descending parallel channel after making a top of 79.45 and closing at 68.11 which is -14.27% in the last trading session. Moving forward, 67.10 acts as a major support which is tested three times, if it breaks then the second support lies at 61.10 lower level of the channel. On the other hand, if the channel breaks above then first and second resistance levels lie at 84 and 79.45 respectively.

ISL | International Steel LTDAnalyzing the current chart, we observe the formation of a Flag pattern and currently it shows break out and retest from its flag. Initial target of the stock is around 74.50-75 and secondary target is around 78. In a long term, upon completion of the flag pattern, the price can reach to 88 level also. Use stop loss if it breaks 64.

ISL (Swing call)ISL as per my previous call going toward our 2nd target 80 then 84 and ultimately 102 so for swing traders accumlate at current rates.

ISLPlan1
Buy1 around 69.55 - 70.55
Buy2 around 64.20 - 65.20
TP(1) around 73
TP(2) around 75 - 76
Stoploss 63.50 (closing basis)
Plan2
Buy Above 75
Sell around 78 - 79
Stoploss 70 (Closing basis)


PSX -ISL OutlookISL has given the breakout of last Lower High and establishing higher higher and higher low. ISL has tried to break the 67 level twice however it failed in both attempts Entry is recommend upon 67.47 breakout.
Entry:67.47
SL: 60.90
TP1:74.04
TP2:80.61
