KSE100This chart shows a multi-timeframe technical analysis of the KSE100 Index, highlighting bearish divergence across four different timeframes: 1-hour, 4-hour, daily, and weekly.
Bearish divergence doesn’t always mean a reversal, but it often leads to consolidation or correction. Stay cautious, manage risk, and wait for confirmation before entering new positions.
Short-Term: Pullback likely in lower timeframes (1hr/4hr).
Medium to Long-Term: Healthy correction expected before continuation.
KSE100 trade ideas

KSE100-BEARISHit, my suggestion not a advise plz you can take your own analyse also in my vision it will bearish in coming sessions.

Cup & Handle Formation!Bearish Divergence on Daily & Weekly TF.
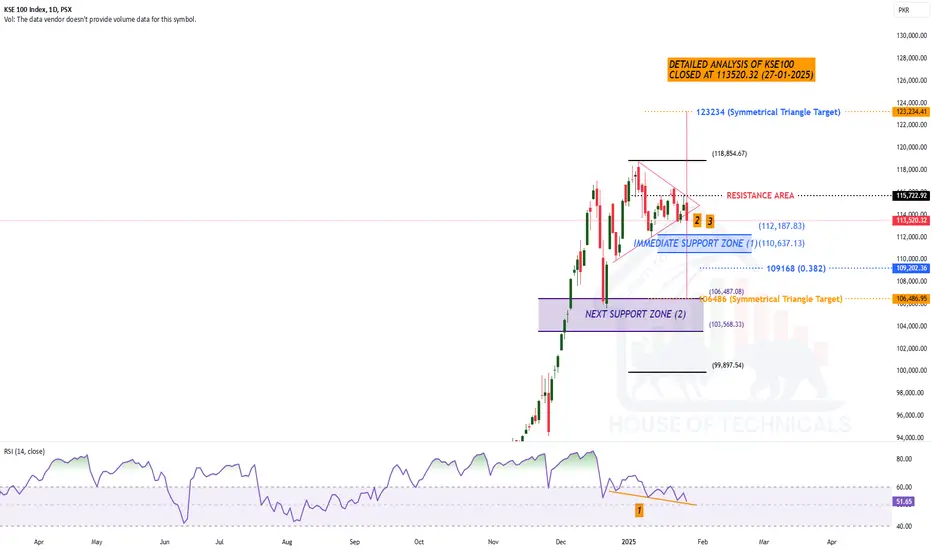
Now Strong Resistance is around 119500.
Cup & Handle Formation appearing at the Top.
Support Levels mentioned.

Resistance Playing WellBearish Divergence on Daily & Weekly TF.
Now Strong Resistance is around 119500.
Cup & Handle Formation appearing at the Top.

KSE100 Index Technical & Fundamental OutlookThe index formed a potential Tweezer Top on the daily chart, signaling a possible short-term reversal after an extended rally. RSI is also nearing the overbought zone, suggesting the market may be due for a mild correction or consolidation. On the fundamental side, rollover week and the upcoming Eid holidays are likely to trigger profit-taking, as investors look to secure gains and reduce exposure before the long break. A brief pullback cannot be ruled out in the coming sessions, so caution is advised at these levels

KSE 100 likely to unleash above current resistance on 1D TFOn 1D TF, KSE 100 is forming a triangle pattern which has already been broken to the upside. Present price levels are also above 21 EMA which is another supporting factor. However, there is one major confirmation still awaited w.r.t breaking of the resistance area (115383.90-116975.30). Seeing the price movement and no opposing indications on RSI, it is expected that breaking above the aforementioned resistance area shall take the market upto 127248.06.
So, my stance will remain bullish above 116975.30.
Good luck.

KSE-100 Index: The Trend Is Your Friend (2025) 2025 (Sideways Market: 102,000 - 118,500)
Market Behavior: Likely to move in a range-bound manner with resistance at 118,500 and support near 102,000.
Strategy:
Traders: Focus on short-term swing trades between support and resistance.
Investors: Consider accumulating fundamentally strong stocks on dips.
Stop-loss: Below 102,000 to avoid deep drawdowns.
Further H/D/W/M based Analytical Reviews Contact US---

Approaching a Critical Breakout – Triangle Squeeze Nearing End!KSE100 is nearing the apex of a symmetrical triangle, indicating a potential breakout move in the coming sessions. A strong breakout above the key resistance zone of 116,000 could trigger a bullish rally toward the 126,000–127,000 range, provided 117,800–119,000 is sustained. Multiple bullish indicators are aligning — higher highs and higher lows formation, RSI holding around 56, and time cycle strength in early March. However, traders should remain cautious of the overhead resistance at 115,000, 116,300, and 118,700–119,000 levels. On the downside, important support lies at 111,500 and 109,440, with a final stop-loss zone near 105,000. If downside pressure increases, the symmetrical triangle’s bearish target could stretch to 100,800. Watch closely — this triangle squeeze could define the market’s direction for weeks ahead!

Breakout ExpectedSymmetrical Triangle Formation.
Breakout Expected around 116000;
Targeting 126000 if 118700 - 119000 is sustained.
Important Support Levels:
S1 around 111500
S2 around 108500 - 110200
Immediate Important Resistance is around 119000

PSX-HOPEA chance of pull back here is head & shoulder
pattern is formed at 1 hour timeframe let see
what,s happen if momentum is continue then
we can hope for good scenario in future.

KSE-100 Symmetrical Triangle: A Breakout on the Horizon?If the KSE-100 index crosses 117,200, it signals a strong bullish breakout, potentially paving the way for further gains. On the downside, a break below 105,000 could confirm a bearish trend, leading to deeper corrections.
Key levels to watch:
📉 Weekly Support: 110,600 – 112,200
📈 Weekly Resistance: 115,500 – 115,700
Traders should monitor volume and momentum for confirmation before making moves. 🚀📊

Weekly+ Monthly ViewWeekly
Recently printed HL on Weekly TF; which is intact
as long as 109400 is Not Broken.
Still Bullish but may remain Sideways unless
Crosses 117200 (Bullish) or Breaks 105000 (Bearish).
Weekly Support is around 110600 - 112200
Weekly Resistance is around 115500 - 115700

23 FEB 2025, KSE - 100 A simple yet clear viewThe volumes are low as compared to last year. As the big money stopped flowing into stocks for a moment the retail traders and the aggressive players are also waiting for a clear signal in the market.
The KSE 100 is very confusing right now. The simplest and most clear view is that the market is sideways and consolidating as we saw last year in these months.
Whoever is trying to analyze the KSE 100 and thinking that he can figure it out or all the youtubers, they don't know anything about technical.
Right now none can predict anything on the index.
The best thing is to stop watching the index until it closes above mentioned levels and focus on stocks only right now.

EVERY MOVE IS NOT REAL MOVE : PAKISTAN INDEXBubble is making in progress and just for bail out getting such rally

Kse100-consolidationAccording to technically in psx not a big bounce is showing at least two months after that it will be a bull move can start. In this era selective stocks could perform so change your selections of stocks time to time.

Consolidation PossibleImmediate Support level is around 111582 - 110602.
Resistance is Still the same around 113000 & then around 115500 -115700

KSE100 Yet to Clear its Direction.
I have also put 3 test cases for Future Learning that I will share with My Students later Inshaa ALLAH.
Under all those Test Cases, Index should show Positivity in Upcoming Days (may be tomorrow or onwards). But Tomorrow's Closing is Important to see.
Either it fails or play (as expected), there would be a lot of New Learning (for me atleast) Inshaa ALLAH.
But You Guys, Focus on Your Scripts 😛
GALA's Explosive Potential – A Technical Outlook for 2025Current Market Structure & Momentum
GALA is currently trading at $0.0285, up by +4.61%, showing signs of potential accumulation. The chart presents a strong historical cycle of breakouts (BOS – Break of Structure) and retracements, which typically indicate a high-volatility asset gearing up for another bullish wave.
Key Bullish Indicators
Smart Money Concepts – The presence of Buy-side Liquidity at multiple levels signals that institutional players may be accumulating. Historically, such patterns have preceded massive price surges.
Nadaraya-Watson Envelope Support – The price is currently in a discount zone, meaning this could be a prime accumulation phase before a major rally.
Historical Pump Patterns – Previous price cycles show massive price expansions following extended accumulation periods. The last breakout saw an explosive run from $0.015 to $0.08 (~+400% gain).
Price Targets & Potential Growth
If GALA follows a similar trajectory, a 300% move from the current levels would target $0.12, aligning with historical resistance zones. However, if macro factors, gaming adoption, and broader market trends support the rally, a full-scale bull run could push prices towards the $0.50 to $1.20 range in 2025.
Investor Takeaway
🔹 Current accumulation zone suggests a strong potential for an upcoming rally.
🔹 Break of key resistance levels (around $0.05-$0.07) could fuel a parabolic move.
🔹 Long-term holders and strategic investors may find this an ideal accumulation zone before a potential explosive breakout.
With increasing blockchain gaming adoption, a growing Web3 ecosystem, and GALA's historical patterns, this could be a golden opportunity to position yourself before the next wave of institutional and retail interest floods in! 🚀🔥

PSX-NEUTRALAfter rising wedge formation now market is in falling wedge formation it will come back soon.

Play WiselyMonthly Candle as of Today (21-01-2025) is DOJI which is
actually indecisive. (Neutral)
Index is Bullish on Bigger TF. (Positive)
Hidden Bullish Divergence on Daily TF (Positive).
Broke the Trendline (Negative) but Possible Re-Testing around 118000 (Positive).
Weekly Bearish Divergence. (Negative)
Weekly & Monthly Closings are Very Important.


Retest 90k? KSE 100simple idea.
Think we need to see a profit sharing dip to maybe 90k. Because 100k is what everyone will expect but it should go lower.
Buying between 80 to 90k should be good.

Play WiselyIt seems that Index may touch around 115000 - 115300
once before going further down (if it has to).
It has touched the first Support level (around 112750 as mentioned on 05-01-2025)
The Stance is Still the Same that 118900 is Important to Cross with Good Volumes
to Continue the Bullish Momentum.
