KSE-----100-----BULLISH AS trend is upward making higher and higher low now trend make the formation of cup and foloow the 50 ema
KSE100 trade ideas

KSE100 index price is moving upward forming cup pattern also observed double top formation, consolidation suppose to be handle of cup, with projection in red dotted lines.

PSX KSE 100 Rising Triangle Pattern- Target 82000+ after breakout at 79300
- Volumes are still low
- Policy Rate Cut could trigger activity in the market and help market with the targets.

KSE100 Daily Time FrameHas touched and taken support on the Conversion Line. Base Line is descending, and a crossover may take place with Base Line, which will confirm downward movement. Lagging Line has breached the Price Line and the Conversion Line and if it penetrates the Base Line, it will strengthen the notion that Market is towards the Selling / downside side. Price which had initially taken support on Span A, has now entered it again. If the Market continues downwards, its next expected stop will be the EMA 44, which is just above the S1.
Further more, while analyzing the MTF, KSE100 is Bullish on the HTF, but is Bearish on H4 and lower Time Frames. Please bear in mind the fact that the Analysis has been done on the basis of Ichimoku

KSE100 INDEXStill Bullish and Potential to
touch 85000 then 87000.
Immediate Support around 76000 - 76500.
Market is safe as long as trading
above 71500 - 71700

PSX 100 INDEXMy bais on KSE 100 index is bearish on the following points;
1. Currently market is traded under ema 10
2. Last candle also inverted hammer which also indicate the further decline of index
3. bearish channel is not break out
4. Decreasing Volumes
5. RSI also showing bearish trend
KSE100 HOURLYKSE100 march towards the Discount zone. Let's wait and see what happens as market is quite uncertain due to geopolitical world situation.

KSE100 INDEXThe continuous decline in market volumes indicates a lack of interest from "smart money". If the market volumes do not improve, we may see the market falling towards major demand zones, such as 76,000, 74,500, and then 70,800. The market will start performing once volumes revive from these demand zones; otherwise, it may only bounce back slightly with low volumes.


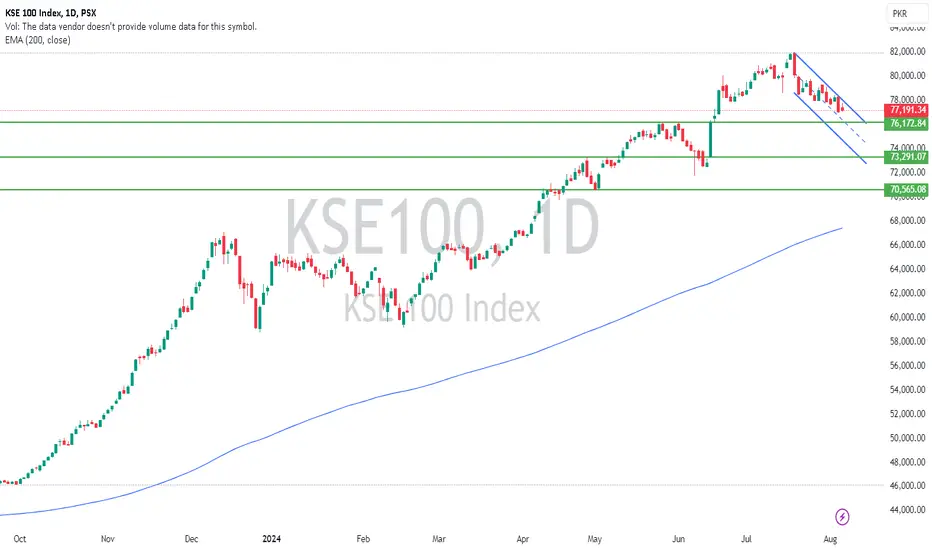
KSE 100 | Bearish Flag Formation on 15m time frameThe KSE 100 Index is currently exhibiting a bearish flag formation. The projected target for this formation is approximately 76,200. This level, which previously served as a resistance following the formation of a double top pattern, may now act as support following its breakout on June 14, 2024. It is advisable to monitor this level closely and adjust trading strategies accordingly.

KSE100 Index AnalysisNext Upside and Downside levels anticipated for 23-07-2024 and onwards keeping in view the volatility of the Market. If correction is completed then upside move evident, otherwise it can land down.

KSE 100 IndexKSE 100 is currently rejecting from its resistance around 80,810, with the expectation of break and sustain and we expect market can test its next resistance that lies around 86,690 in the upcoming quarter and on the flip side, its support lies around 76,187.
Expected Levels for the next quarter
Resistance: 86,690
Support: 76,187


Still BullishStill Bullish and Potential to
touch 85000 then 87000.
Immediate Support around 76000 - 76500.
Market is safe as long as trading
above 71500 - 71700

KSE 100 15 minute dataKSE 100 15 minutes data with high low open and close values with historical data for purpose of trend identification

KSE 100 4 hour chart dataKSE 100 bench mark index 4 hour chart data including high low close and open prices with historical data


KSE 100 15 minute chart with historical prices and trendKSE 100 15 minute chart with historical prices and trend of PSX

KSE 4 hour data pointsKSE 4 hour data points for historical values along with values of high low close and open

KSE 100 Index 15 minutes for trend analysis and historical valueKSE 100 Index 15 minutes for trend analysis and historical values.


KSE-100 - Multi-year H&S playing outThis looks like a multi year bull run in the making .... publishing this idea so I can track it down the line.

KSE100 Index | PSXThe KSE 100 index has seen a strong uptrend in the last five trading sessions, leading bullish investors to aggressively take profits around the 80,000 mark. This indicates that investors are cashing in gains following a substantial rally, potentially resulting in a brief period of consolidation or a slight pullback. The 80,000 level is a significant psychological hurdle, and how the market reacts here will be pivotal in shaping its future trajectory.
Bearish divergence with RSI is observed on daily time frame, which can predict the beginning of a bearish trend or short term consolidation. The initial support of the index is found in a range of 76,250 - 76,000. If this level is breached, secondary support lies in a range of 72,300 - 71,900.
