KSE 100 is BullishKSE-100 is currently facing selling pressure after a parabolic move, it has printed an all time high of 67k, and is currently undergoing a correction, which could possibly define a new higher low for this bullish rally. No divergence on RSI is a clear indicator that the rally is not finished, and there is still some room for upward movement.
KSE100 trade ideas

KSE100KSE100
Support 1: around 61600
Support 2: around 57500 -58300
is se ziada I don't give Importance to Index.


Bears are lostThe KSE 100 Index concluded its most recent trading session at 66,223, indicating a positive gain of 1505.56 points or 2.33%. Significantly, the index demonstrates bullish momentum. We advise investors for a cautious stance and focus to explore day trading opportunities with a strict stop loss policy.

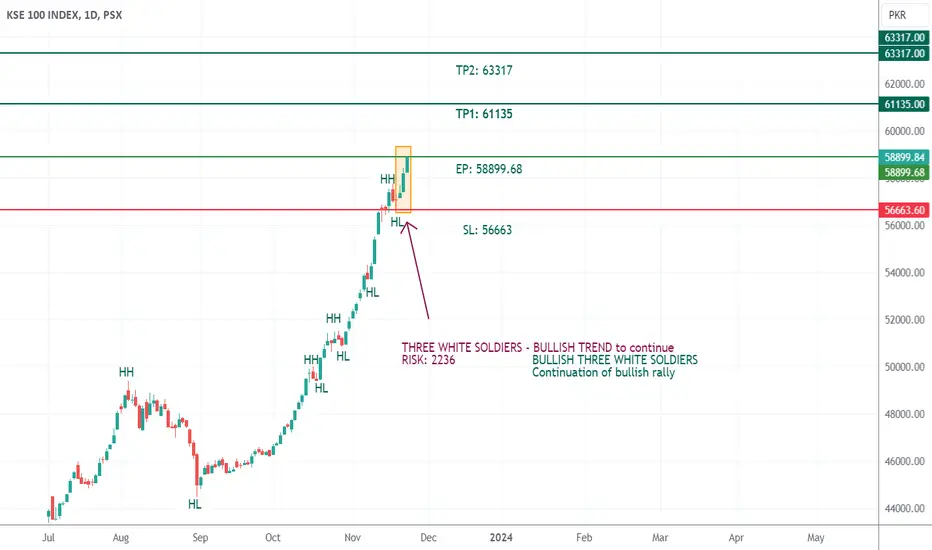
KSE 100 index - BullishKSE 100 index bullish - 3 white soldiers
KSE 100 index is on a bullish rally for past 3 - 4 months and this shall continue due to the bulllish patterns visible in the trend
PSX KSE 100 reversal @58413 pointscurrently KSE100 is in bullish rally which soon looks to vade near @58413, after that markt will retrace and then may print new high, if new high is printed above 59K then a new bull run will start which may go beyonf 75K

Hanging Man Candlestick on KSE100Introduction:
Over the last five months, the KSE 100 Index has displayed a remarkable rally, surging from 39,894 in June 2023 to 56,873 as of today, November 14, 2023—an impressive 42.5% return in a relatively short period. While investors have enjoyed these gains, the current market situation requires a discerning eye.
The Hanging Man Candlestick: A Signal to Exercise Caution:
Today, the KSE 100 Index has formed a hanging man candlestick, indicating a potential reversal. Notably, a similar pattern emerged on October 24, 2023, when the index reached a high of 51121. Surprisingly, that hanging man did not result in a reversal, and the bullish trend persisted.
Precautionary Measures:
While a hanging man candlestick alone doesn't guarantee a trend reversal, historical context prompts us to consider precautionary measures:
Review Portfolio Allocation:
Assess your portfolio allocation and ensure it aligns with your risk tolerance and investment objectives. Consider rebalancing if necessary to maintain a diversified and resilient portfolio.
Set Stop-Loss Orders:
Establish clear stop-loss orders: to limit potential losses in the event of a significant market downturn. This disciplined approach helps protect gains and manage risk.
Stay Informed:
Keep a close eye on market news and economic indicators . Any unexpected developments could impact market sentiment and trigger rapid market movements.
Consider Hedging Strategies:
Conclusion:
As we navigate these dynamic markets, it's crucial to balance technical analysis with historical context. The previous hanging man candle on October 24, 2023, reminds us that not every signal leads to a reversal. Stay vigilant, review your strategies, and adapt to market conditions. #MarketAnalysis #InvestingWisdom #RiskManagement #PSX #KSE100

Testing all times highToday's closing is very important for the index as market is testing major resistance level which was seen 6 years ago. Please be alert to close positions in profit where possible if shares were bought for trading.
If market closes on an upward trend, market can show bullish momentum
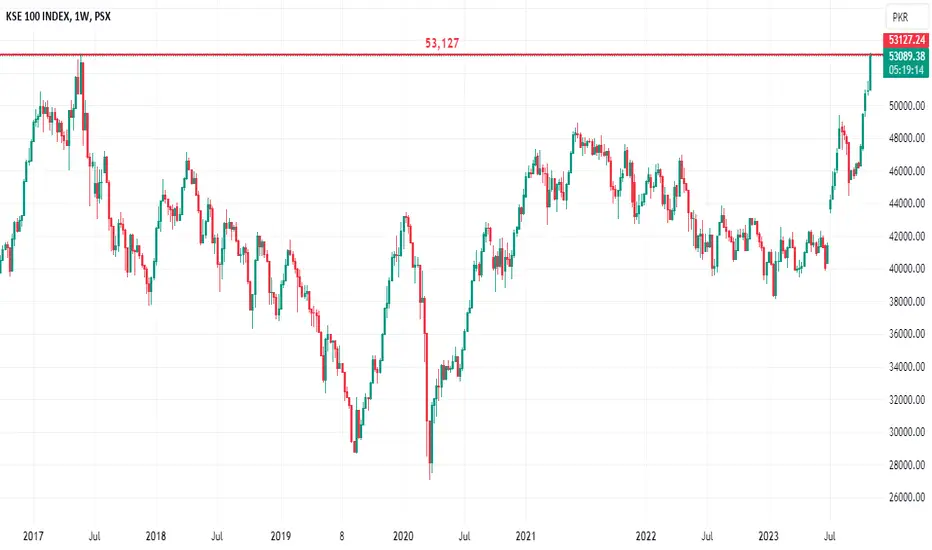
KSE 100 53,127 🚀🚀The KSE 100 Index gained 339 points and gave closing at 51,070 with a high of 51,419. Index can test resistance of 53,127 with a support of 49,400.
Furthermore, RSI is above 72 level which shows market is over-bought and MACD shows bearish signal.

KSE 100 Bearish DivergenceKSE 100 Index show bearish divergence on hourly, daily and weekly time frame, it shows market is at over bought level and in todays session, market give rejection from its resistance level of 51,000. Better to book profits on high sides use stop loss for safe trading.

KSE 100 index correction startedKSE 100 index started rejecting after making doji candel which shows sign of reversal and bearish divergence is formed with RSI on daily and week time frame. Index can give 50% correction from its last impulse to 47,238. Which acts as major support level.

KSE 100 Index toward all time highThe KSE 100 Index has shown a significant pattern with a break out of double top formation with bullish momentum. Furthermore, Index is challenging the resistance of 50,887 that need to break for the testing all time high of 53,127. Previous resistance of 49,404 now acts as first support level for the index and if the support breaks then 48,976 will be the second support.
Moreover, Index is highly over bought on weekly and daily time frame and shows bearish divergence on weekly time frame., while MACD suggests a bullish sign.

Struggling for break outThe KSE 100 Index has shown a significant pattern with a double top formation at the 48,976 level, which now serves as a major resistance point for the index. If this level is breached due to high trading volume, the index may then target its next resistance level at 53,127. On the downside, the first support level is situated at 46,590, while the second support level is at 45,771.
Moreover, it is worth noting that the Relative Strength Index (RSI) has crossed the 64 level, indicating potential bullish momentum, while the Moving Average Convergence Divergence (MACD) suggests a bearish trend when analyzed on a weekly time frame.

KSE 100 index sell side tradeAs KSE 100 index is moving towards it H4 supply and will return immediately from there if we get any rejection on level we will be shorting
The confluance for sell baised is on H4 break of structure as higher low was broke and move back upward and we will return from supply level

KSE100 IndexThe KSE 100 Index has successfully broken above its resistance level at 46195 and has now established this level as support after closing above it. This development suggests that if bullish sentiment continues in the market, the index could target its next resistance level at 47262. Furthermore, if this resistance is surpassed and sustained, the subsequent resistance level is approximately 48441. Conversely, if the support level at 46195 is breached, the index may test its second support level at 44460.
Additionally, the Relative Strength Index (RSI) currently stands at the 55 level, indicating the potential for upside movement. Moreover, the Moving Average Convergence Divergence (MACD) is crossing above, accompanied by a decrease in bearish volume and an increase in bullish volume, which signifies bullish potential in the market.

KSE 100 - BULLISH CONTINUATIONKSE 100, after retracing till 50% Fib level started another bullish leg. Its likely to break above the last High level and if that happens ABCD pattern will be confirmed. In that scenario, the next target of the Index shall be around 54000 level which will be Potential Reversal Zone.


KSE-100 ANOTHER BULL RUN IN SIGHT ON WEEKLY CHARTS.KSE-100 Index posted huge gains of 24% in just 6 weeks. Afterwards correction comes in. This downward movement corrects up to 10%.
At this juncture we are faced with the question What next.
To find the answer we dig in to the past behavior of the KSE-100.
Our dive yields three instances from the past.
1. 23rd January 2017 to 17th April 2017 KSE-100 loses 9.51% in 13 weeks before it resumes the trend.
2. From 7th Sept 2020 the KSE-100 loses 10% of its value in 12 weeks to resume its journey to north.
3. From 1st Feb. 2021 to 3rd May 2021 KSE-100 loses 10% again and in 12 weeks too.
This brings us to he probability that if the same pattern is repeated the resumption of trend can begin from or around 16th of October 2023.
This notion can further be augmented if the return of Mian Nawaz Sharif, as speculated, coincides.
If the History repeats itself the target for the next move shall be 54175.

KSE-100 Short Sell may be the option.IMF deal for the Pakistan served as the trigger for market. It posted hefty gains in the short span of time. but going forward it seems the market seems to be having a breather and time to correct itself.
Keeping in mind any such scenario the levels to go short has been defined and possible target area, in accordance with the Fib. Retracement, has been marked.
To keep the both end covered it has also been defined from which point to go Long.

KSE 100 Daily ChartKSE 100 Daily Chart 22 Aug 2023.
First Trendline support broken dated 07 Aug 2023.
2nd Trendline support broken dated 16 Aug 2023.
Trendline strong resistance bold black line.
Daily supply level 48846 is very important.
Last HL is 47262 very important and price must hold it.
Price has broken the previous week's low 47893.
Daily price is between Darvas neutral BOX.

KSE100 Daily ChartKSE 100 Daily Chart. Trendlines support and resistance levels, Daily supply level, higher high and lower low, Candlestick weekly price action stop loss, when to buy and take profit levels. regards

KSE 100 - BULL FLAGKSE 100 index is forming a Bull Flag structure, indicating continuation of the Bull Trend. The confirmation will be breakout above the marked level and upon breakout, Long positions may be planned

KSE 100 Daily ChartKSE 100 Daily Chart
Trendline and Trendline broken level.
Fibonacci Retracement level.
HH LL.
Order Blocks.
