MARI ShortSince July 2023, Mari has never breached and closed below SMA10 on monthly timeframe.
If it breaches it and closes below 588, the downfall will be sharp.
Its first stop would be 519 and then 446 and 415 can also be on cards.
Sorry for Mari lovers but it can become a harsh reality.
However, 415 to 4
Next report date
—
Report period
—
EPS estimate
—
Revenue estimate
—
60.14 PKR
77.29 B PKR
181.83 B PKR
224.89 M
About MARI PETROLEUM COMPANY LTD
Sector
Industry
CEO
Faheem Haider
Website
Headquarters
Islamabad
Founded
1984
ISIN
PK0066301018
FIGI
BBG000GN6ZS7
Mari Energies Ltd. is engaged in the exploration, development, and production of hydrocarbon potentials, which includes natural gas, crude oil, condensate and LPG. The company was founded on December 4, 1984 and is headquartered in Islamabad, Pakistan.
Related stocks

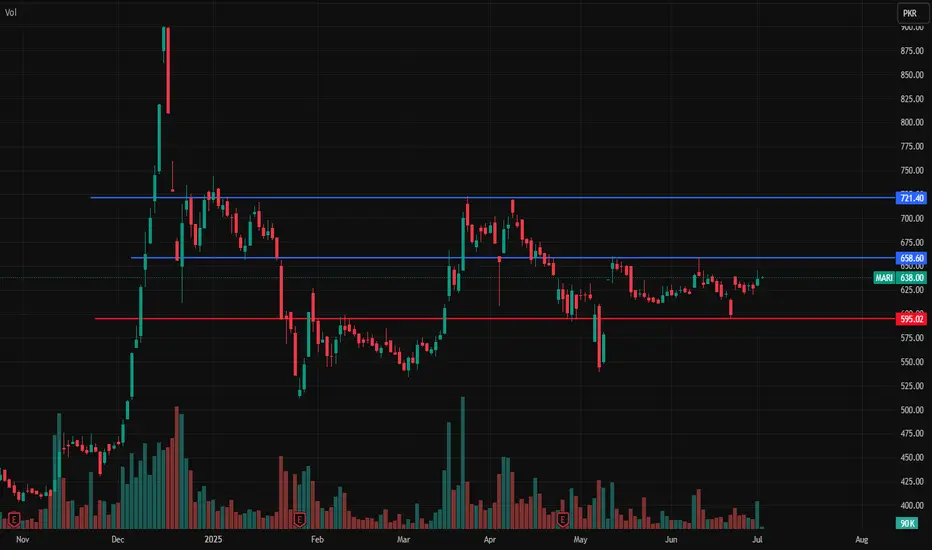
Mari Key levelsMari is in bullish trend and buying is possible with blue lines TP and red line SL
Note: This is not a buy/sell trade call.
MARI Trade Idea1- Price is in uptrend and HH/HL are intact.
2- Price is stalling within golden pocket zone.
3- Price squeezing in between wedge pattern.
4- RSI on weekly @ 52 and monthly @ 66 which
is showing that bullish momentum is intact.
5- We need to wait for bullish candlestick pattern
within GP or b

MARI Petroleum Company Ltd (PSX) Buy Idea✅ Buy Idea Summary
Symbol: MARI
Timeframe: Daily
Current Price: 652.96
📊 Analysis & Plan
Context:
Price has bounced from a higher-timeframe demand zone (highlighted in blue) and is currently forming a bullish structure.
Key Observations:
Swing Failure Pattern near top (distribution clue).
Liquid

MARI PROBABLY IN WAVE '' C '' OF CORRECTION - SHORTThis is in continuation to our ongoing tracking of MARI.
MARI is most probably in wave C of an ABC correction and since prices moved down giving confidence to our bearish wave count, we are taking a small position by short selling.
Due to market volatility we will trade this setup with cautious us

Mari Swing trading targetsMari is entered into bullish trend and entry is possible, TP1 is 660 and TP2 is 700. SL is 593.
Note: This is not a buy/sell trade call. trade at your own will and analysis. This is for education purpose.

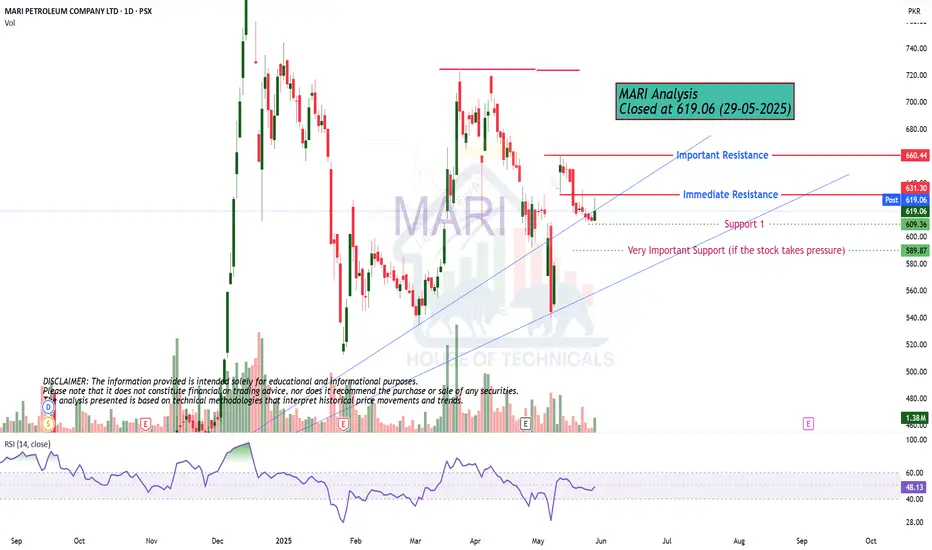
Hidden Bullish Divergence
Hidden Bullish Divergence has appeared.
Bullish on Bigger tf.
Doji formation.
Immediate Resistance is around 642 - 650.
Important Support levels for now can be
around 595 - 605.
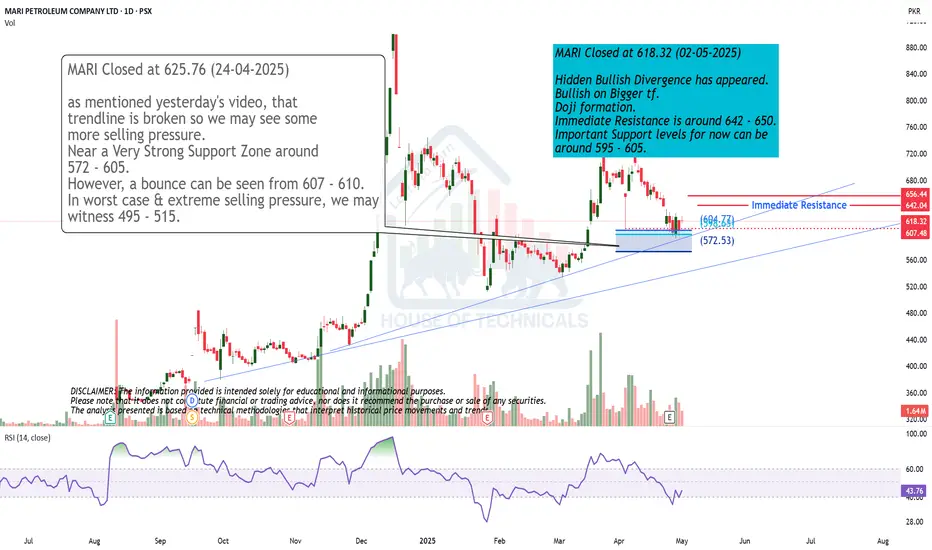
Play on levelsas mentioned yesterday's video, that
trendline is broken so we may see some
more selling pressure.
Near a Very Strong Support Zone around
572 - 605.
However, a bounce can be seen from 607 - 610.
In worst case & extreme selling pressure, we may
witness 495 - 515.

MARI PROBABLY IN WAVE '' C '' OF CORRECTION - SHORTThis is in continuation to our ongoing tracking of MARI.
Since prices moved down giving confidence to our bearish wave count, we are taking a small position by short selling. They are several possibilities at hand therefore we will trade this setup with cautious using trailing stop loss until we re

See all ideas
Summarizing what the indicators are suggesting.
Neutral
SellBuy
Strong sellStrong buy
Strong sellSellNeutralBuyStrong buy
Neutral
SellBuy
Strong sellStrong buy
Strong sellSellNeutralBuyStrong buy
Neutral
SellBuy
Strong sellStrong buy
Strong sellSellNeutralBuyStrong buy
An aggregate view of professional's ratings.
Neutral
SellBuy
Strong sellStrong buy
Strong sellSellNeutralBuyStrong buy
Neutral
SellBuy
Strong sellStrong buy
Strong sellSellNeutralBuyStrong buy
Neutral
SellBuy
Strong sellStrong buy
Strong sellSellNeutralBuyStrong buy
Displays a symbol's price movements over previous years to identify recurring trends.
Frequently Asked Questions
The current price of MARI is 622.28 PKR — it has decreased by −0.33% in the past 24 hours. Watch MARI PETROLEUM COMPANY LTD stock price performance more closely on the chart.
Depending on the exchange, the stock ticker may vary. For instance, on PSX exchange MARI PETROLEUM COMPANY LTD stocks are traded under the ticker MARI.
MARI stock has fallen by −1.55% compared to the previous week, the month change is a −1.36% fall, over the last year MARI PETROLEUM COMPANY LTD has showed a 108.13% increase.
We've gathered analysts' opinions on MARI PETROLEUM COMPANY LTD future price: according to them, MARI price has a max estimate of 670.00 PKR and a min estimate of 570.00 PKR. Watch MARI chart and read a more detailed MARI PETROLEUM COMPANY LTD stock forecast: see what analysts think of MARI PETROLEUM COMPANY LTD and suggest that you do with its stocks.
MARI reached its all-time high on Dec 16, 2024 with the price of 900.23 PKR, and its all-time low was 0.28 PKR and was reached on Apr 2, 2004. View more price dynamics on MARI chart.
See other stocks reaching their highest and lowest prices.
See other stocks reaching their highest and lowest prices.
MARI stock is 1.45% volatile and has beta coefficient of 1.54. Track MARI PETROLEUM COMPANY LTD stock price on the chart and check out the list of the most volatile stocks — is MARI PETROLEUM COMPANY LTD there?
Today MARI PETROLEUM COMPANY LTD has the market capitalization of 747.12 B, it has decreased by −1.11% over the last week.
Yes, you can track MARI PETROLEUM COMPANY LTD financials in yearly and quarterly reports right on TradingView.
MARI PETROLEUM COMPANY LTD is going to release the next earnings report on Sep 3, 2025. Keep track of upcoming events with our Earnings Calendar.
MARI earnings for the last quarter are 13.25 PKR per share, whereas the estimation was 12.03 PKR resulting in a 10.14% surprise. The estimated earnings for the next quarter are 10.80 PKR per share. See more details about MARI PETROLEUM COMPANY LTD earnings.
MARI net income for the last quarter is 16.05 B PKR, while the quarter before that showed 11.27 B PKR of net income which accounts for 42.50% change. Track more MARI PETROLEUM COMPANY LTD financial stats to get the full picture.
MARI PETROLEUM COMPANY LTD dividend yield was 37.46% in 2024, and payout ratio reached 175.37%. The year before the numbers were 9.71% and 34.94% correspondingly. See high-dividend stocks and find more opportunities for your portfolio.
As of Jul 26, 2025, the company has 1.65 K employees. See our rating of the largest employees — is MARI PETROLEUM COMPANY LTD on this list?
EBITDA measures a company's operating performance, its growth signifies an improvement in the efficiency of a company. MARI PETROLEUM COMPANY LTD EBITDA is 107.07 B PKR, and current EBITDA margin is 64.99%. See more stats in MARI PETROLEUM COMPANY LTD financial statements.
Like other stocks, MARI shares are traded on stock exchanges, e.g. Nasdaq, Nyse, Euronext, and the easiest way to buy them is through an online stock broker. To do this, you need to open an account and follow a broker's procedures, then start trading. You can trade MARI PETROLEUM COMPANY LTD stock right from TradingView charts — choose your broker and connect to your account.
Investing in stocks requires a comprehensive research: you should carefully study all the available data, e.g. company's financials, related news, and its technical analysis. So MARI PETROLEUM COMPANY LTD technincal analysis shows the sell today, and its 1 week rating is neutral. Since market conditions are prone to changes, it's worth looking a bit further into the future — according to the 1 month rating MARI PETROLEUM COMPANY LTD stock shows the buy signal. See more of MARI PETROLEUM COMPANY LTD technicals for a more comprehensive analysis.
If you're still not sure, try looking for inspiration in our curated watchlists.
If you're still not sure, try looking for inspiration in our curated watchlists.