Bullish on Bigger TFBreakout from the Important Support Level.
Immediate Targets can be around 600 - 610.
On the flip side, Important Support is around 537 - 560
MARI trade ideas

Same Support level tested againUpdate as on 06-03-2025
Support level that was
mentioned a month ago, again played
well.
Now again 600 - 630 is the resistance for now.

Technical analysis of MARI petroleumIt is in downtrend on daily chart and honouring the first support level.In case the index performs and it generates reasonable volumes then it'll go through Rs.618 easily and move towards its second resistance level of Rs.720.On the other hand in case it breaks its first resistance then it'll be clear to forsecond support level at Rs.425.So far it is showing signs to bounce back from current stage.


MARI Technical Analysis: Potential Buy Opportunity MARI presents a compelling buy setup. The stock is in a confirmed uptrend, recently bouncing off a key trendline within the crucial 0.618-0.78 Fibonacci retracement zone, a key area of support. A bullish inverted hammer candlestick, followed by another positive candle, formed at this level, suggesting renewed upward momentum. The RSI confirms this bullish sentiment, aligning with the price action. Recommended entry points are at the current market price (583) and a secondary level at 484.16. A stop-loss below 378 on a closing basis is recommended for risk management. Target profit levels are 716, 880, and an open target for potential further gains. Happy trading!


MARI will not give upMari is giving a good opportunity to ride at current retracement phase. Currently it is at 23% Fibb Level where i made a good hammer candlestick with nice volumes on daily chart.
1st Buy Reason:
Great Management, Nice Fundamentals. Trading at Accummulative Level.
2nd Buy Reason:
Wanted to Buy many shares on 1st Buy. But Couln't did at that time. Invested again when money came in.
3rd Buy Reason (Will do on Friday Dt 24-01-2025:
I always buy good stocks if it goes down -9% within a week.
Trading at 23% of Fibb Retracement
Signalling a good hammer + volume increase.
4th potential Buy: Around 464 Level
5th potential Buy: Around 360 Level

MARI - PSX - Trading in Sideways Trend for 20% gainMARI is moving between 660 to 740 over the past one month or so.
KVO is dipping which suggests a further dip in price. RSI is also dipping much below Zero level.
Therefore, I'm eager to see it test 610 level once more. However, this is No 1 Stock of PSX and may attract Buyers at any time. Therefore, I'll buy in steps to make sure I have the stocks at lower rates.
Trade Values
Buy-1: 660
Buy-2: 640
Buy-3: 620
Buy-4: 610
TP-1: 708
TP-2: 720
TP-3: 735
SL: 600
Buy-5: 760 (Once price moves above this parallel channel sufficiently)
SL-5: 745

MARI Petroleum good support zone MARI Petroleum good support zone
Buy Big
Next move will be above PKR 1000/-

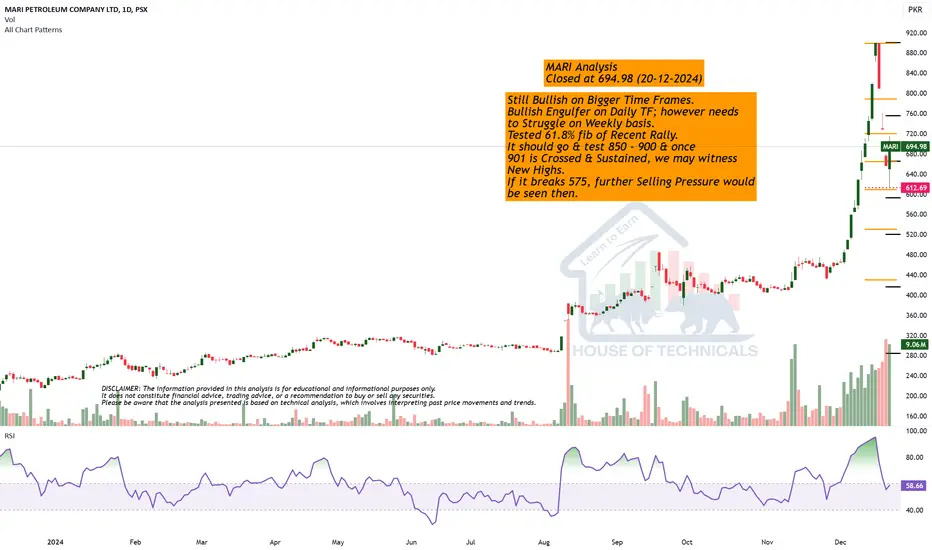
Still Bullish on Bigger Time Frames.
Bullish Engulfer on Daily TF; however needs
to Struggle on Weekly basis.
Tested 61.8% fib of Recent Rally.
It should go & test 850 - 900 & once
901 is Crossed & Sustained, we may witness
New Highs.
If it breaks 575, further Selling Pressure would
be seen then.
ATRL: First Target: 900ATRL: First Target: 900
TP2: 1134
ATRL boucned back from Golden Zone and stayed there and closed at 694.
First Resistance :
is 788. If it breaks and close above then it might go to 900 Fist TP

Mari is heading to 900 againMari did not drop more to below its support of 594. it dropped from its support of 666 and bounce back again and broken resistance of 666 and touched 715. It is likely to cross again 755 and heading to 900 again. Use stop loss below 666
Note: This is not a buy/sell call. Trade at your own
will.

MARI - PSX - Technical AnalysisOn daily TF, MARI has defined a Higher High and has came down to define a Higher Low.
Currently almost 52% Fib retracement (Rs 655) has done. Price may even further drop to Fib 61.80% (Rs 610). Now, this is the golden pocket (50~61.80%) retracement zone, where most financial institutions prefer to enter.
Trade Values
Buy-1 (CMP) : 660
BUY-2: 635
SL: 550
TP-1: 895 (Just before previous ATH)
TP-2: 1105

MARI PETROLEUM - LONGMany people are concerned about MARI, but I believe it will recover around the 30-minute EMA, approximately 650-660. After a brief consolidation, the next move upward may follow. The chart outlines the target levels.

MARI - Technical AnalysisMARI is in bull run as ever. RSI and KVO also suggesting strong buying.
Fundamentally very strong and now showing its true potential. New entrants may buy now or wait for the dip expected shortly but that would be very brief.
Trade Values
Buy : 558
SL: 429
TP-1: 604
TP-2: 731
TP-3: 797

Still Bullish but...Double Top Formation (Bearish).
However, Still Bullish on All Time Frames,
if it Crosses & Sustains 490 - 491, we may witness
516 - 517 immediately.

0.618 Fib SupportIt has taken Support from 0.618 fib level.
If 485.50 is Sustained, we may witness
580 initially.
On the flip side, 407.50 is immediate Support
on Monthly basis.

MARI potential Buy setupReasons for bullish bias:
- Fundamentally a very strong company
- Price respecting upward trendline and is at 0.382 Fib level
- Overall a bullish trend
- Divergence also getting synched
Here are the recommended trading levels:
Buy 1: 402 (CMP is also good)
Buy 2: 384.19
Stop Loss Level: Closing below 355.8
Take Profit Level 1: 482.91
Take Profit Level 2: Open

Though still BullishThough still Bullish but there is a Bearish
Divergence on Weekly TF.
Should wait for 3200 - 3215 initially,if this level
is broken, we may witness 2800 - 2850 levels for Entry.

Mari Petroleum Limited (MARI)Recommendation: Buy
Target Price (Jun-25): 3,660.5 PKR
Last Closing: 2,713.5 PKR
Upside (%): 34.9%
Key Points: Significant production growth,
high profitability, strong financial health,
and robust dividend payouts(AHL Pakistan Strategy

MARI | MonthlyMARI (Monthly) : The price action established a bullish trend from 1,515 in Oct' 2023 and makes a high of 2,849 in May' 2024. Currently it is showing rejection from its top. At present resistance lies at 2,849, upon breaching next resistance lies around 3,211. On the flip side, 38.2% retracement lies at 2,339 and 50% retracement at 2,182 these level are consider as support levels.

Mari Petroleum - Preparing for Bearish Move- Price making HH's
-Rsi making LH's
-Volume making LH's
- Price is about to turn around for bearish move anytime.

MARI Bearish DivergenceIn a Bullish Market, I observed Bearish Divergence on 1D Timeframe
Indicating reversal of price trend.
Accordingly, I planned sell stop trade at the breakout of HL.
Stop Loss was placed at the breakout of HH.
