MLCF - Cooling down after a long rallyMaple Leaf is cooling down after a long rally and is preparing for touching its all time high.
It struck Fib 0.618 level and is now spending some time here as expected. It may retrace to its Fib 0.5 level (73 to 74) before again going up.
Once it crosses and gives monthly closing above 88, we can see it hitting 108 and then 133 in quick succession.
MLCF trade ideas

HH Printed on Bigger TfEither it should Sustain 78 - 79,
or
Better to wait for its retracement
towards HL, may be around 69 - 70.
Next Support would be around 70 -71

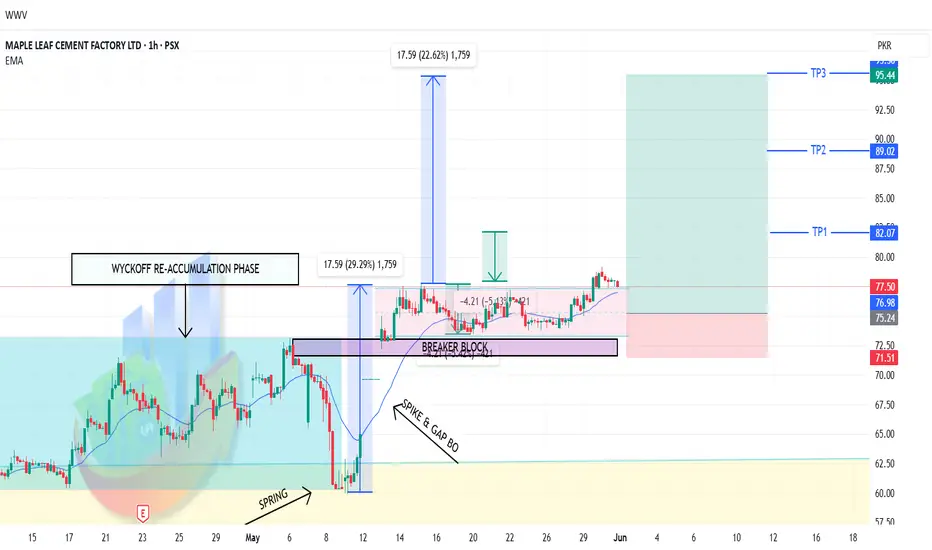
MLCF LONG TRADE (1H TF)MLCF LONG TRADE - on 1H TF
MLCF has been in uptrend since Nov 2024, with a high of 79 on charts.
On LTF/1H, it has recently completed its Wyckoff Re-Accumulation Phase (blue channel) and Broke out of it in shape of Spike and Gap. It continued to consolidate in a Double Bottom Pattern.
This Spike and Double Bottom jointly formed Double Bottom Bull Flag (pink channel). Along with these events, Volume gradient also supports an impending up-move. Importantly, it created a Bullish Breaker block on 1H when it Broke out of the DB Bull Flag, which is a low-risk spot to enter the long trade. The price is also above EMA-20.
Targets have been calculated from different Measured Moves as marked.
🚨 TECHNICAL BUY CALL – MLCF 🚨
BUY1: 77
BUY2: 75
BUY3: 73
📈 TP1 : Rs. 82
📈 TP2 : Rs. 89
📈 TP3 : Rs. 95.25
🛑 STOP LOSS: BELOW Rs. 71 (Daily Close)
📊 RISK-REWARD: High Conviction | 1:5.4
Caution: Please buy in 3 parts in buying range. Close at least 50% position size at TP1 and then trail SL to avoid losing incurred profits in case of unforeseen market conditions.
PLEASE BOOST AND SHARE THE IDEA IF YOU FIND IT HELPFUL.
Monthly Closing is important.Crossing & Sustaining 70 - 72 would
be a Very Healthy Sign for further Upside
towards 78 - 80.

Currently Near Resistance.67 - 68 is a Very Strong Resistance.
We may witness Selling pressure towards
55 -58.
Though it is Currently Bullish, but Fresh
Entry is not recommended unless 68 - 69
is Crossed & Sustained with Good Volumes.

MLCF Bullish ideaMLCF pullback from OTE & breakers 2 time.
Bull flag created as well.
Targetting -1 fib.

Trade Item MLCF 18/04/2025 Analysis Time 03:47 AM📈 MLCF (PSX) – Strong Buy Alert!
🗓️ 18/04/2025 | ⏱️ 30-Min Timeframe
MLCF is looking bullish with solid momentum on the 30-min chart. Great opportunity for short-term traders!
💸 Buy Range: 62.50
🎯 Target: 67.40
🛑 Stop Loss: No Stop Loss (High-risk, high-reward strategy)
Technical indicators are showing strength, and volume is backing the move. Watch closely for confirmation and breakout continuation.
🚀 Trade at your own risk. This is not financial advice.

MLCF AS PLANNEDMLCF respected all the level and did exactly as marked. I was just going through my previous analysis and just looked at this amazing chart. thought to share with you! look at the patterns and the perfect breakout retest strategy I mostly play with.

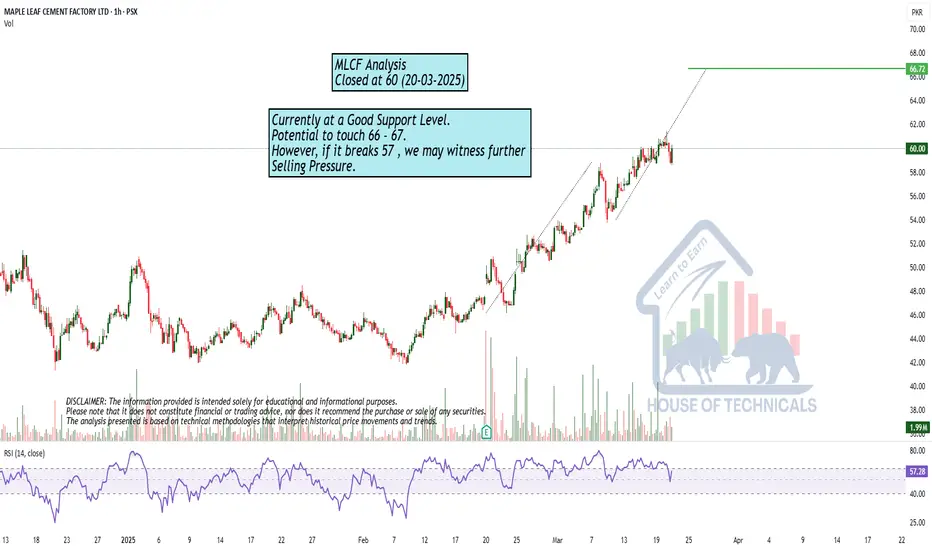
at Important Support LevelCurrently at a Good Support Level.
Potential to touch 66 - 67.
However, if it breaks 57 , we may witness further
Selling Pressure.
MLCF : Uptrend but short-term pullbackKey Observations:
Elliott Wave Count:
Currently, the stock is at the peak of wave (3), indicating that a short-term correction (wave 4) might be expected before the price resumes its uptrend toward wave (5).
48-50 PKR is a strong demand area for a potential bounce,If its Hold an upward move toward 62-65 PKR is expected in wave 5.
RSI It recently touched an upward trendline, indicating a potential overbought condition, possibly leading to a short-term correction.

MLCF WEEKLY TIME FRAME AND TRADE IDEAMLCF GAVE A BREAKOUT AT THE ACCUMULATION BOX. THE STOCK IS HEADING TO WEEKLY STRONG RESISTANCE AT 50.92
BUT EXPECTED TO BREAKOUT DUE TO THE SENTIMENT AND THE DESECENDING ACCUMULATION JUST BEFORE THE WEEKLY BREAKOUT LOOKS LIKE A CONFIRMATION. LOOKS LIKE THAT
THE BIG PLAYERS HAVE FILLED UP THIER BAGS AND READY FOR THE BREAKOUT
HOWEVER THIS MIGHT BE PLAYED NEXT WEEK OR IN THESE NEXT FEW DAYS
WATCH FOR PRICE ACTION ON H2 AND H4
BREAKOUT AT 50.92 will start a new quick rally however a retest might be possible at the breakout level at 50.92 to 5. The next target will be 58 to 59.
watch for order flows in orderbook. and look for the 5m timeframe above vwap session near breakout

MLCF – Breakout vs. Fakeout – What to Watch?
:
The stock is testing a long-term resistance trendline, which has previously acted as a strong barrier.
A breakout should be confirmed with strong volume for sustainability.
If a rejection occurs, price action could see a short-term pullback before retesting resistance.
Key price target post-breakout: 58+ PKR
Potential Buying Zones:
Buy-1: Around 48-16%
Buy-2: Around 44-22%

MLCF Bullish Breakout – Trend Continuation?MLCF is showing bullish strength on the higher timeframe, breaking its previous higher high and signaling trend continuation. If it holds above this breakout level, further upside towards is possible


Recently made a HL on Daily TF.Recently made a HL on Daily TF.
However, Bullish Momentum will continue once
the price will cross 52.
43 - 44 may act as an Immediate Support, & if
it Sustained on Weekly basis, we may witness
50 again.
But if 41 is broken, it may expose new lows
around 36 - 37.

Beautiful Bullish Flag (M) Eying BreakoutA beautiful bullish flag has formed on the monthly charts, with projections around 56 . However, there is strong resistance around 48 , which could be a good point to offload a small portion and consider rebuying after a pullback or once the resistance is cleared. The exact target of the projections will depend on the value where the breakout occurs, so adjust your strategy accordingly!
Note: Always consider your own research and risk management before making any decisions.

MLCFThe price action is in uptrend, currently trend line resistance lies around 40 which consider as the first target of MLCF. For swing trading setup, price needs to break out for upside projection.

MLCF | Flag PatternMLCF is making flag pattern, break out is already observed, flag projection lies around 48


CUP & HANDLECup & Handle formation is there with
intial resistance around 43.50
Crossing & Sustaining 43.50 may
lead it towards 50 - 51 and then 60+

MLCF is BullishPrice was in a strong downtrend, however a matured bullish divergence hints that bulls are assuming control of the price action. If previous lower high is broken successfully, then we can expect a bullish reversal as per Dow theory. Targets are mentioned on the chart.

MLCF is BullishPrice was in a downtrend, however the bullish divergence on daily time frame suggests that bulls are trying to attain control of the price action. The bullish notion is further confirmed by the break of previous lower high and printing of a higher high. If thee momentum sustains then we can expect a bullish rally as per Dow theory. Targets are mentioned on the chart.
