MLCF trade ideas
MLCF | Parallel Channel🚀 Stock Alert: MLCF
📈 Investment View: Technically Bullish 📈
🔍 Quick Info:
📈 Entry Range: 38.50
🎯 Target Level : 42
⚠ Stop Loss: 36.20
⏳ Nature of Trade: Short Term (Scalping)
📉 Risk Level: Medium
☪ Shariah Compliant: YES
💰 Dividend Paying: NO
📰 Technical View: The price is in an ascending parallel channel and making higher highs and higher lows with the closing at 38.09 in the last trading session. A pull back from the lower channel is observed for the target of 39.40 and upon break out it can test 41 level. Use stop loss at 37 if it break below of the channel.

MLCF/PSXA bullish flag is a technical analysis pattern that indicates the continuation of an existing uptrend in a financial asset. It is named for its resemblance to a flag on a pole, where the "pole" is a sharp price increase and the "flag" is a period of consolidation or slight retracement that follows.
Characteristics of a Bullish Flag:
Flagpole:
A significant and rapid price increase leading up to the flag.
Indicates strong bullish momentum.
Flag:
A period of consolidation or slight downward retracement.
Typically takes the shape of a rectangle or parallelogram that slopes against the prevailing trend (downwards in this case).
Volume tends to decrease during the formation of the flag.
Breakout:
Occurs when the price breaks out above the upper boundary of the flag.
Confirmation of the pattern and often accompanied by a spike in volume.
Interpretation:
Continuation Pattern: The bullish flag suggests that after a brief consolidation, the price is likely to continue moving in the direction of the previous trend (upward).
Price Target: The potential price target after the breakout can be estimated by adding the length of the flagpole to the breakout point.

MLCFWe can attempt to buy MLCF from specified level if it give breakout of range/yellow consolidation box ,LH, trendline resistance , also there is no bearish divergence at current levels indicate that it move upward .
SL , TP mention in chart.

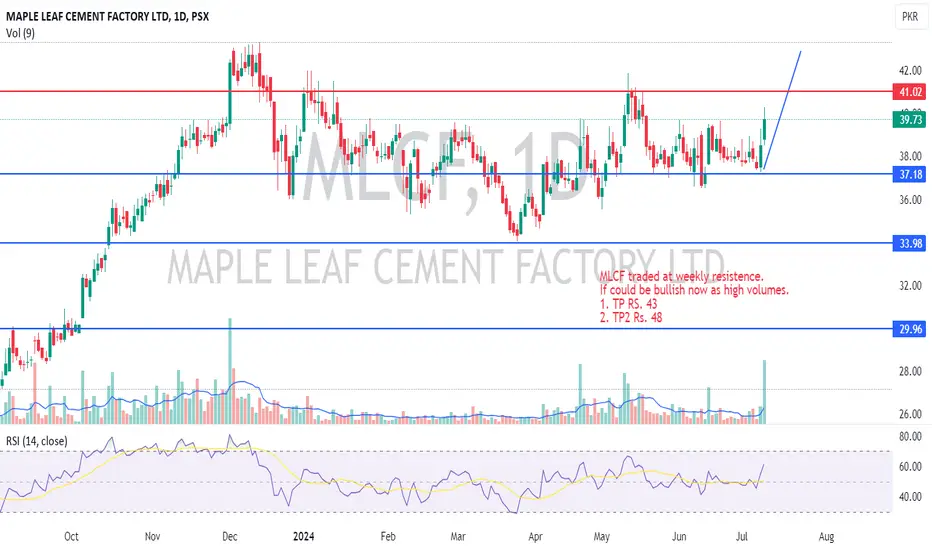
MLCF target are 43, 46 & 50. This is my analysis on MLCF and according to my analysis MLCF just break its resistance of 39.35 and the nest targets are 43, 46 & 50. Kindly take your profits and remember me in your prayers.

MLCF is BullishMLCF was trending downwards, however bears seem to be exhausted now and breaking of previous lower high confirms this sentiment. Formation of a Higher Low followed by a Higher High would mark the beginning of a bullish move as per Dow theory. Targets are mentioned on the chart.

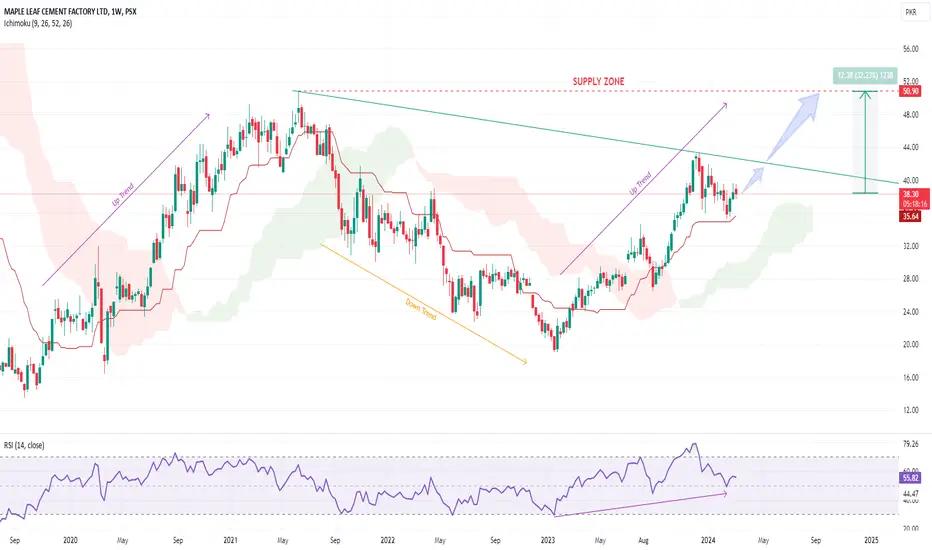
✳️ MLCF | Low Risk vs High RiskMLCF is currently exhibiting indications of a breakout from its descending trend line, indicative of a shift towards an uptrend. A notable supply zone is situated around the price level of 50.90, which may present resistance and necessitate a decisive breach to facilitate further upward movement. The substantial trading volume is reinforced by a notably strong RSI, suggesting a robust market sentiment. A target price of 50.90 has been delineated, reflecting a prospective gain of 32%.
Thank you for reading.
If you boost, I know you enjoyed the content and I can continue to publish more.
Feel free to follow.
Thanks a lot for your support.
Assalam O Alikum.
MLCF | Flag PatternWe're looking at two possible outcomes based on the flag pattern we've noticed in MLCF stock.
Firstly, if the stock price breaks out and closes above 38, it confirms the flag pattern. According to this pattern, the initial target could be around 43. If the pattern completes, the target could go up to around 50.
On the other hand, there's a chance the stock could drop. In this case, a support level is expected to be around 31-32. If it reaches this level, a rebound in price, known as a pullback, is anticipated.

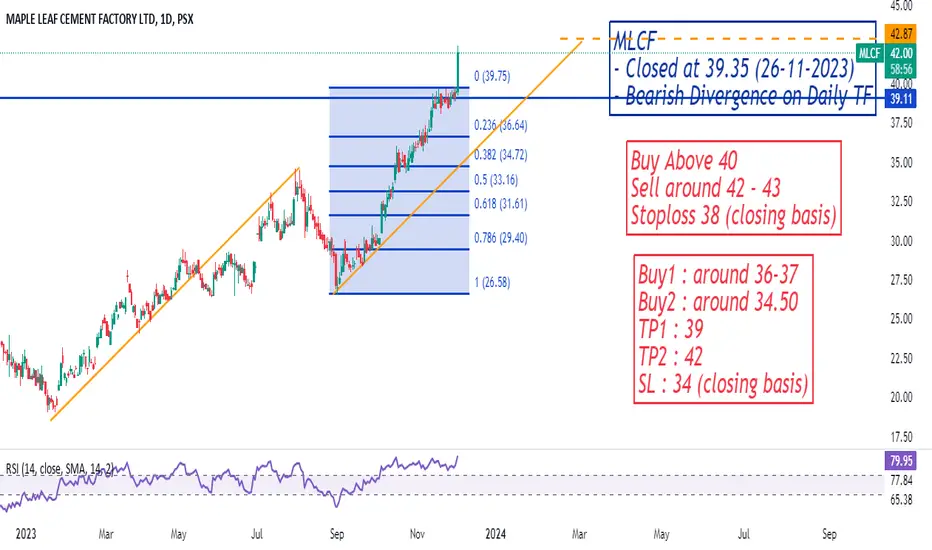
MLCF - Bullish TrendMLCF reversed bearish trend to bullish trend with entry through Fib Golden Ratio.

MLCFCall was shared on 26-11-2023 when it was at 39plus
Made a low of 38.47 on 27-11-2023
Current rate 42.40
MLCFThe prevailing market conditions indicate that the price action is currently confined within the parameters of a triangular pattern, with established resistance observed within the 40-43 range. A discernible observation is the stock's positioning in the concluding phases of this pattern, identified as wave E, thereby suggesting the culmination of intermediate wave C within the evolving upward corrective cycle. A breach beyond the resistance at 43 would serve as a catalyst for an upward trajectory, setting a prospective target in the vicinity of 50.90.
Furthermore, the Relative Strength Index (RSI) indicator is noteworthy for its positioning within the overbought zone, situated above the level of the preceding low. This nuanced trend in the RSI aligns with the overarching uptrend in the market. Conversely, a weekly closure beneath the threshold of 36 would signify a vulnerability in the price dynamics, potentially paving the way for a subsequent descent towards the subsequent support level at 34.

MLCF PSX KSE100Price consolidates and breakout around 41+ now with handsome volume moving to the next fib level around Rs.51+

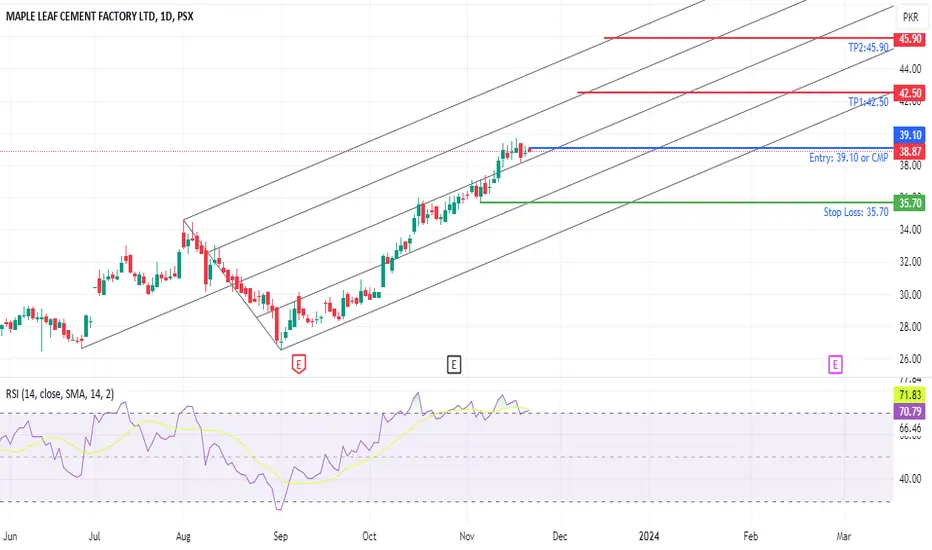
PSX - MLCF OutlookAs MLCF has given the breakout of LH and heading towards heights. apart from part of top volume leaders and we can also active buy back from MLCF company which is also strong indictor bullish trend expected. I highly recommend to hold the MLCF for long term.
below are the Short term trading entry levels
Entry:39.10
SL: 35.70
TP1:42.50
TP2:45.90

MLCF:PSX is expected to continue downtrendMLCF:PSX was analysed on 1D time frame and has been observed to print LHs and LLs. Simultaneously, bearish divergence is also evident on RSI. Therefore a short entry through a Sell Stop order has been on price breaking down below that last LL. SL has been placed above 61.8% fib level of swing as it hasn't completed forming the new LH. It may be adjusted in coming days if so required. TP has been set as per 1:1 RRR.

MLCFMLCF currently trades above its 200-period Simple Moving Average, indicating a bullish trend with higher highs and higher lows. If it breaks the initial resistance at 30.10, the next target is 33. The first support is at 28.30, with a secondary support at 26.52 if the initial support is breached. These levels serve as key references for price analysis.


Long Term on MLCFOn longer term it has broken weekly trend. Wait for the retrace and confirm for going long!!! Lets see what happens@@@
