Though in Uptrend but..NETSOL
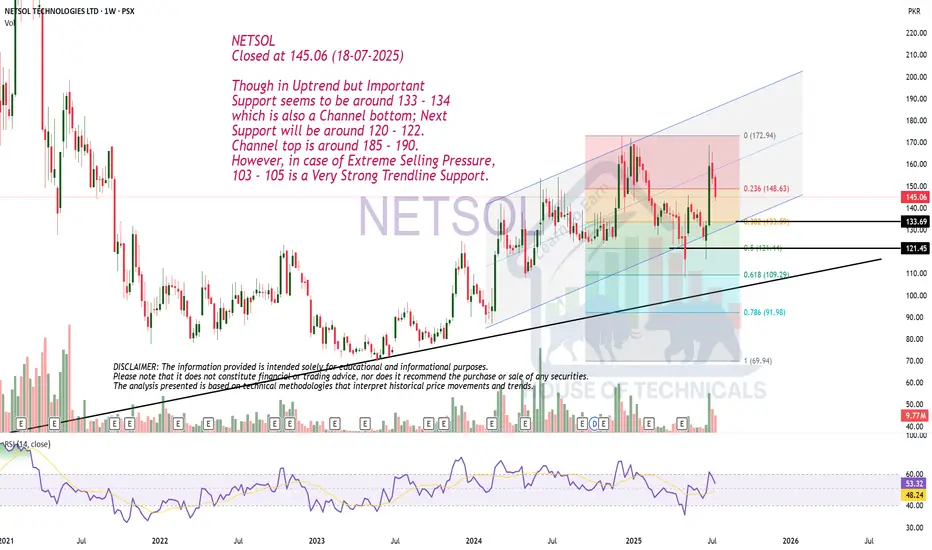
Closed at 145.06 (18-07-2025)
Though in Uptrend but Important
Support seems to be around 133 - 134
which is also a Channel bottom; Next
Support will be around 120 - 122.
Channel top is around 185 - 190.
However, in case of Extreme Selling Pressure,
103 - 105 is a Very Strong Trendline Support.
NETSOL trade ideas
NETSOL – LONG TRADE | 12 JULY 2025NETSOL – LONG TRADE | 12 JULY 2025
The stock is trading within a range marked by a blue channel. After touching the resistance area, the stock has created several bullish structures, indicating potential upside beyond the current range.

ABCD Pattern NETSOL Analysis
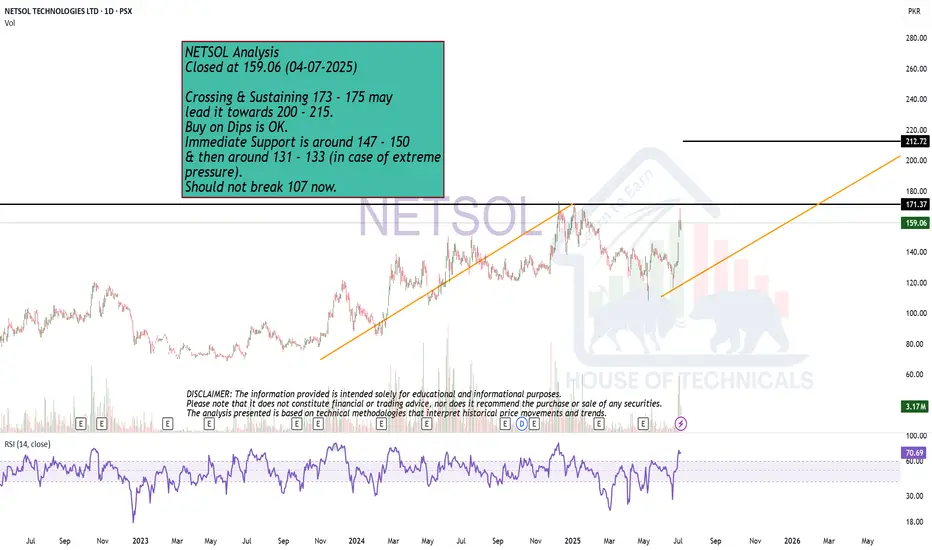
Closed at 159.06 (04-07-2025)
Crossing & Sustaining 173 - 175 may
lead it towards 200 - 215.
Buy on Dips is OK.
Immediate Support is around 147 - 150
& then around 131 - 133 (in case of extreme
pressure).
Should not break 107 now.
NETSOL | Swing Trade SetupTrading Note: NETSOL Technologies Ltd. (NETSOL) - Long Position Recommendation
Date: June 13, 2025
Subject: Potential Long Opportunity from Major Support Level
Overview:
This note recommends considering a long position on NETSOL from its significant major support level around 125. Recent price action suggests a compelling opportunity for a bounce from this historically pivotal zone.
Analysis of the 125 Support Level:
The price level of 125 stands out as a critical major support for NETSOL. This level has consistently acted as a strong demand zone, where buying interest has historically emerged to halt downward momentum and initiate price reversals. Looking at past performance, the price has made several notable pullbacks from this area. Each time NETSOL has approached 125, leading to a rebound in price. This repeated rejection of lower prices at 125 underscores its importance as a robust psychological and technical barrier, indicating strong underlying demand. The recent sharp drop and subsequent bounce reinforce the continued relevance of this level.
Recommendation:
Based on the strong historical significance and recent price action, a long position is recommended from the major support level around 125. Traders should consider entry points near this level, potentially with a stop-loss placed just below the immediate lower support marked by the red zone on the chart (around 120) to manage risk.
Target:
Initial targets could be set towards the previously established resistance around the 142 range, aligning with the potential for a rebound towards the upper boundary of the indicated channel.
Disclaimer: This analysis is for informational purposes only and should not be considered financial advice. Always conduct your own due diligence and consult with a qualified financial advisor before making any investment decisions.

NETSOL Long term targetsLong term targets for NETSOL once it breaks out the triangle are listed in chart. You can take it either as Fib 1.618 or the price arrow top as your targets.

Netsol - Inverse H&S into playNetsol is in its buyback phase which is about to be over in June.
Inverse H&S is in play where it hit its daily pivot level. If it now makes a higher high and higher low, 2nd shoulder will be confirmed. Alternatively, it may hit 123 (bottom of its first shoulder) before going upward. Upside short term target will be 183.

Bullish Setup
Closed at 141.02 (21-05-2025)
Beautiful Bullish Divergence +
Inverse H&S in progress.
As mentioned earlier, 144 - 146 is
an immediate resistance; once crossed
& sustained, we may witness 152 - 155
& then 175 - 180.

Beautiful SetupClosed at 141.02 (21-02-2025)
Beautiful Bullish Divergence +
Inverse H&S in progress.
As mentioned earlier, 144 - 146 is
an immediate resistance; once crossed
& sustained, we may witness 152 - 155
& then 175 - 180.

NETSOL- LOMG TRADENETSOL has reached bottom of its upward channel.
It has created an excellent Spring/Bear Trap in Oversold area/bottom of channel.
It is a low risk high probability set up
BUY 1 @136
BUY 2 @ 130
SL BELOW 123
TP1 @ 155
TP2 @ 166
R:R=3:1

at the verge of Breakout!
at the verge of Breakout!
Sustaining 136 - 137 would lead it towards
141 - 144 & then 148-150.
Otherwise, 120-121 seems to be a Good
Support level.
and this time if 108 is broken,we will see
heavy Selling.

NETSOL LONG TRADENETSOL is rebounding from its strong support after liquidity sweep, Weis Wave Volumes show positive shift of volumes to bullish side
BUY NETSOL 124-128
TP 142
SL 119

Still a Good Buy but with proper Stoploss.Still a Good Buy but with proper
Stoploss.
Immediate Resistance is around 134 - 135
Crossing it may take the price towards
140 - 144 initially. & then the Double Bottom
will play and may hit 160+

Morning Star formationMorning Star formation
Weekly Closing above 125 would be positive.
However, 143 - 144 is the resistance zone.
Crossing it with Good Volumes will move the
price towards 155 - 160.

Netsol is in ideal buying zoneNetsol is in ideal buying zone of 130 and 117. Its selling zone is 140 to 154.
Note: This is not a buy sell trade call, trade at your own analysis and will.

NETSOL | Inverse H&SNETSOL is forming inverse head and shoulder pattern on daily time frame, strategy should be buy on dip in between 129 – 131 for the upside target of 136 – 137 level followed by 140 – 142 level. Use stop loss below 127 on closing basis

NETSOL BUY idea PSX NETSOL BUY idea PSX
Bullish Divergence
Going for new HH
SL 122.45
Entry 142
Tp1 1RR
TP2 2 RR

NETSOL LongIt is totally my assumption and can be wrong as well. This is not a buy / sell call.
Netsol is in accumulation phase and may touch the high and touch the trendline shown by Feb-Mar 2026.
The high it may touch will be its Fib level 1.618 i.e. 522 or best assumption can be 538 (difference of its previous high and recent low). Buyback by company is another strong indication of "Something's Cooking".
Have a blessed Ramazan and great trading experience.

NETSOL-Leveraging Parallel ChannelNetsol is currently moving in a parallel channel and is available at lower line i.e. 135.56. Can be bought at CMP with SL of 123.20 and TP can be 168 i.e. upper channel line

NETSOL Technologies (PSX) Hits Oversold Levels NETSOL Technologies Ltd. (PSX: NETSOL) is currently trading at 130.16 PKR, testing a critical support zone after a prolonged downtrend. The stock has been forming lower highs and lower lows, signaling persistent selling pressure.
📉 Technical Breakdown:
RSI (14) at 22.92 – Deep in the oversold zone, indicating a possible short-term bounce.
Price nearing a key support level at 130 PKR – A break below this could push the stock towards 120–125 PKR.
If a bullish RSI divergence or reversal pattern (e.g., hammer, bullish engulfing) appears, a rebound toward 135–140 PKR may be possible.
🚨 Trading Plan:
🔹 Bullish Case: Wait for confirmation of reversal with increasing volume before entering long positions.
🔹 Bearish Case: A breakdown below 130 PKR with strong volume could signal further downside.
📊 Keeping a close watch for a potential trend shift! What’s your outlook? Comment below! 👇🔥 #PSX #NETSOL #Trading #TechnicalAnalysis.

NETSOL |Ascending Parallel ChannelThis chart shows an ascending parallel channel formation for NETSOL, indicating a potential bullish reversal. The pattern suggests bullish momentum with key targets set at different levels: the initial target at 156 PKR, secondary target at 167 PKR, and a parallel channel projection target at 190 PKR. A stop loss is defined at 130 PKR, mitigating downside risk if it breaks the channel downward. This setup suggests traders are anticipating upward movement, with increasing potential as targets are met, though the stop loss limits potential losses in case of a downward move.

PSX - NETSOLTrade Plan
1. Entry Strategy
Buy Zone: Enter near the current price (158.19) or wait for a retest near 148.86 (0.5 Fibonacci retracement of AB) for better risk-reward.
2. Target Levels
Primary Target (TP1): 173.00 (recent high and psychological resistance level).
Secondary Target (TP2): 190.06 (ABCD pattern completion).
3. Stop-Loss
Place the stop-loss below the 0.786 retracement level (135.27), ideally around 132.00, to account for volatility.
4. Risk-Reward Ratio
Risk: ~26 points (158.19 - 132.00).
Reward:
TP1: ~14.81 points (173.00 - 158.19).
TP2: ~31.87 points (190.06 - 158.19).
R:R Ratio:
To TP1: ~1:0.57.
To TP2: ~1:1.22.
5. Position Sizing
Use a position size that risks no more than 1-2% of your trading capital.
6. Exit Strategy
Partial Profit Booking: Close 50% of the position at TP1 (173.00).
Trailing Stop: Move stop-loss to breakeven after TP1 is reached.
7. Risk Factors
Market sentiment or news affecting PSX stocks.
Broader market trends impacting the technology sector.

Flag (Trend continuation) patternNetsol, minimum targets are identified here as TP1 and TP2 through flag pattern. Moreover, the supply zones are also identified as Red Rectangle boxes because of Bearish engulfing candle.

NETSOL hasn't achieved Cup and handle formation Final Target yetThe stock had recently made a Cup and Handle formation on its weekly chart, However, weekly closing has not been over 168, which indicates the fact that stock is likely to retraced till 143 level to get start for another rally towards its Cup and Handle formation target price of Rs. 176.
Recently the HH was around 173. accumulation the stock between 143-155 levels is recommended.
Once weekly closing is above 168, the stock is likely to test its resistance level around 198. If the stock is accumulated at an average price of 150ish, 32% gain can be expected if the stock tested its previous resistance at 198, breaking out 198 level would trigger the next resistance of 226. This movement is expected to be captured by the stock within next 12 months when the stock is likely to break its historical high of 304.75
Stop loss can be kept around 122
