NML Share Buying StrategyNML Share Buying Strategy
buying around 134-132
stop loss 129
target 140 -147
NML trade ideas
NMLStarting to move high from key polarity zone. Just like other textile companies, this one also looks good.
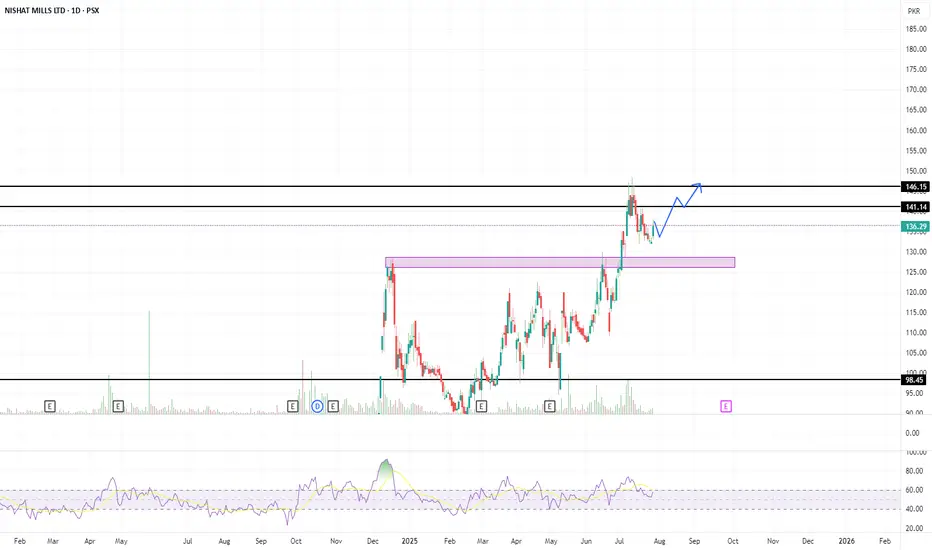
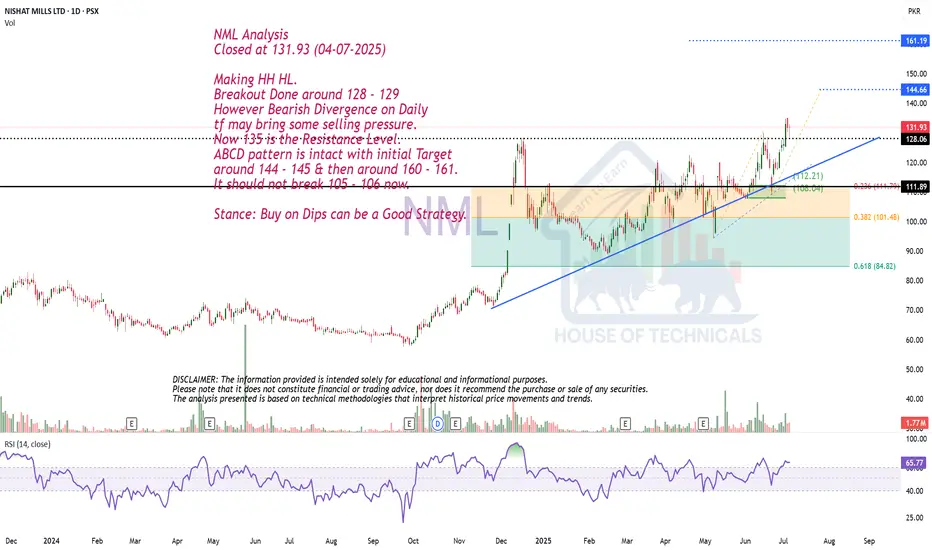
Making HH HL.NML Analysis
Closed at 131.93 (04-07-2025)
Making HH HL.
Breakout Done around 128 - 129
However Bearish Divergence on Daily
tf may bring some selling pressure.
Now 135 is the Resistance Level.
ABCD pattern is intact with initial Target
around 144 - 145 & then around 160 - 161.
It should not break 105 - 106 now.
Stance: Buy on Dips can be a Good Strategy.
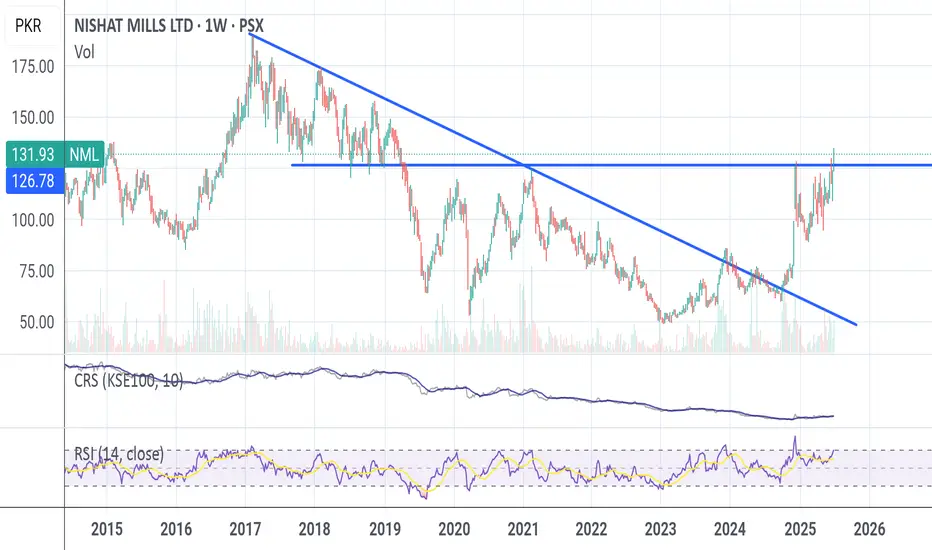
Bullish on bigger tf but Strong Resistance ahead.
Bullish on bigger tf.
Strong Resistance around 128 - 129
If this Resistance is Crossed & Sustained
on monthly basis, we may witness upside
towards 200+

Bullish on Bigger Time Frames.Bullish on Bigger Time Frames.
Immediate Resistance is around 126 - 127.
Potential to touch 200 is 127 is Sustain on
Monthly Basis.
On the flip side, 101 - 111 is the Support level
(if it takes pressure now.
Now it should not Break 89.

Good Trade SetupIt has taken a Support from
a Very Strong Level around 90 - 94.
Immediate Resistance is around 110 - 113
Day / Swing Traders may enjoy 5 - 7 rupees profit.
Good Support level is around 102.50 - 104.50
The Stock has the potential to reach upto 120 - 130
& if this level is Crossed with Good Volumes,
Next Target can be around 150+
96 is an Important level that should not break now.

NML Stock Analysis - *Buying Opportunity:* NML stock is showing a potential buying opportunity due to its ability to sustain above the 50-day Moving Average (MA).
- *Resistance Area:* The stock is facing resistance around 104. If it breaks above this level, it may trigger a bullish movement.
- *Upside Targets:*
- Initial target: 112
- Final target: 124
- *Stop Loss:* 92

NML ON BASES OF DEMAND AND SUPPLY To analyze the chart using demand and supply concepts, we can look at the following points:
Supply Zones:
The upper supply zone appears around the 81.56 to 86.00 range. This is where selling pressure is expected, as prices reached this level multiple times but failed to break through, indicating a strong selling sentiment.
Demand Zones:
The demand zone is evident between 70.00 and 75.52. Price retraced to this area and showed signs of buying pressure, as indicated by the upward movement when it tested these levels.
Recent Price Action:
The current price is at 77.06, which sits right above the demand zone. If it holds here and pushes upwards, it could indicate a continuation toward the supply zone.
If it breaks below 75.52, there could be further downside potential towards the next demand level.
Volume Analysis:
It's crucial to observe volume spikes. Increases in volume accompanying price movements can validate the strength of a breakout or reversal in these zones.
Conclusion:
Watch for price action around the identified zones. A strong move above the upper supply or a rejection from it could signal future trading decisions. Similarly, maintain attention on the demand zone for potential reversals or breakdowns.
Adjust strategies based on how price reacts to these key levels!

NML PSX - Technical AnalysisNML has been in down trend for quite some time. Its price was below monthly bearish trend line.
On Daily time frame it has just crossed above the monthly bearish trend line (orange thick line). EMA 91 is just below its current price on Daily TF. RSI also going up. Only Klinger is facing downwards but it will change.
There are two scenarios:-
Scenario ONE- it will test the highlighted resistance zone and eventually go up;
Scenario TWO - it will drop back below monthly bearish trend line and will continue its bearish trend once again.
Therefore, for sure TP1 is achievable per below plan:-
NML
LONG (Buy) Trade Call
Entry (Buy): 71.50
SL (below Monthly Trend line): 69.80
TP1: 75.95
TP 2: 81.22

NML is making LH LL continuously.
No Bullish Divergence yet appeared.
a Very Strong Trendline Resistance around 65 - 66.
H&S Pattern is there; targeting around 40 - 41 in
worst case scenario.
It needs heavy volumes to Break the level of 65-66
and sustain it.

NML🚀 Stock Alert: NML
📈 Investment View: Technically Bullish 📈
🔍 Quick Info:
📈 Buy Level: 75.50
🎯 First Target: 79
🎯 Second Target: 83.75
⚠ Stop Loss: 72
⏳ Nature of Trade: Mid Term
📉 Risk Level: Medium
☪ Shariah Compliant: YES
💰 Dividend Paying: YES
📰 Technical View: Presently, NML observes 12 million volume in hourly time frame with a break out level. First target lies at 79 and upon break out next target lies around 83.75 with the stop loss at 72.

NMLWe can attempt to buy NML from specified level as it break LH , trendline resistance indicate that it move upward.
SL , TP mention in chart.

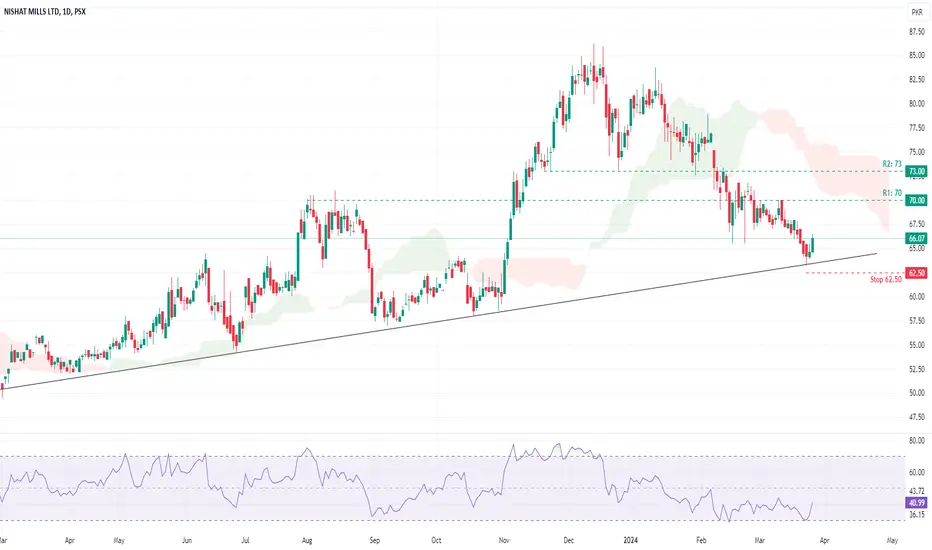
NML🚀 Stock Alert: NML
📈 Investment View: Technically Bullish 📈
🔍 Quick Info:
📈 Buy Level: 66
🎯 First Target: 70
🎯 Second Target: 73
⚠ Stop Loss: 62.50
⏳ Nature of Trade: Mid Term
📉 Risk Level: Medium
☪ Shariah Compliant: YES
💰 Dividend Paying: YES
📰 Technical View: Presently, NML has retracted from its upward trend line, culminating in a closing price of 66.07 in the preceding trading session. It is prudent to contemplate a retracement from its support range spanning from 65 to 66. The initial barrier is foreseen around 70, accompanied by a secondary hurdle envisaged at 73. In order to mitigate risk exposure, it is advisable to institute a stop-loss strategy below the breach of the trend line at 62.50.
NML Bullish Bat PatternNML on the daily chart has made a bullish bat pattern. We are now witnessing a bull trend.

NML is BullishNML is currently on the verge of giving a strong breakout. It has printed a higher low and would soon break previous lower high and print higher high instead, which could potentially mark the beginning of a bullish rally. Targets are mentioned on the chart.

Nishant Mills Ltd. stock appears to be exhibiting bullish signalBased on the monthly chart, NML appears to be showing bullish signs. This could be a good opportunity for potential medium-term gains. As always, it's important to conduct your own research before making any investment decisions.GAINS. However, it is important to do your own research before making any investment decisions.


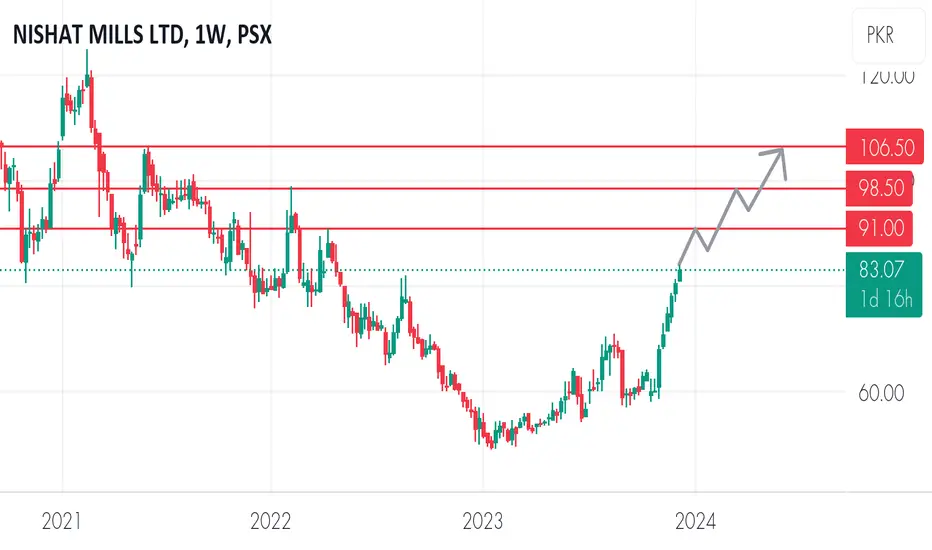
NMLNML is generating short and long term opportunities. Can sell at resistance levels and wait for correct then move to second and then third targets.
R1 - 91
R2 - 98.50
R3 - 106.50
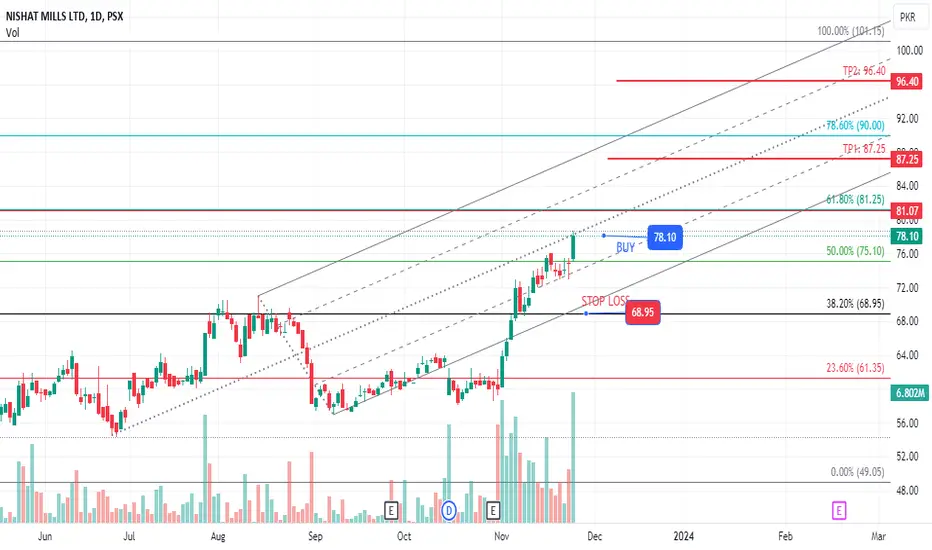
PSX- NML OutlookNML has given breakout of last LH and bulls are getting momentum after breaking the 50% Fib level.
Entry: CMP(78.10)
SL: 68.95
TP1:87.25
TP2:96.40
NML PSX KSE1001. Price defines its bottom now moving in an uptrend
2. Around 75 to 80 there is a Resistant zone and also Fib level.
3. Ideal entry point near below trend line when price takes support

PSX: NML CUP & HANDLE CROSSED OVER ON WEEKEND CHARTSNishat Mills Ltd. (NML) is a prominent Pakistani Textile Company belonging to the Nishat Group.
The company has been in downtrend for very long time. At the start of this Calander year it hit the low which has proved to be the lowest low so far.
Since than the security has been posting gradual increase in price. Thus gaining 40% of its value. In the preceding week the security successfully crossed over the neckline of Cup & Handle formed on Weekend Charts. Although it could not close the week over the neckline it is highly probable that it shall very soon close over the neckline and shall resume its journey to new highs.
Aggressive traders can avail the opportunity to accumulate under the neckline and Cautious fellows can wait for the closing above the neckline. For your convenience SL and TP has been marked on the chart.

NML IDEANML
1- Buy above 71 and target 82-84 area
2- Buy near 65-66 and target 71 & 76
* this is couple scenarios not a call, please do your own analysis and risk management
