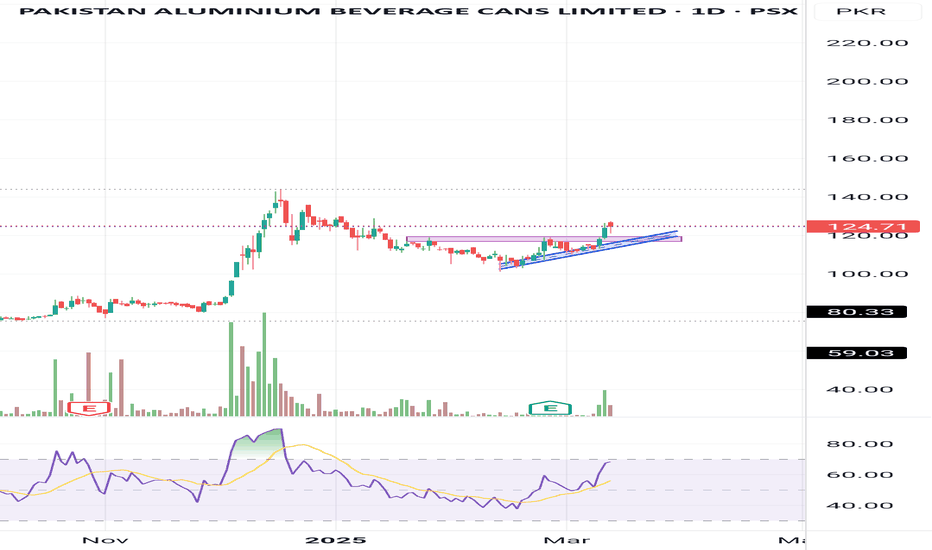
PABC | Formation of CUPThe stock displays a cup pattern on strong volume, trading confidently above both the 20 and 200-day EMAs, suggesting robust upward momentum. Previous session candle was bullish and need pull back for taking a long position near 130 level for the approach of its neck line resistance near 144. Use a stop loss at 123 to manage your risk.
PABC trade ideas
PABC🚀 Stock Alert: PABC
📈 Investment View: Technically Bullish 📈
🔍 Quick Info:
📈 Buying Range : 65-65.50
🎯 First Targets : 67.50
🎯 Second Targets : 72.50
⚠ Stop Loss: 62.50
⏳ Nature of Trade: Mid Term
📉 Risk Level: Medium
☪ Shariah Compliant: YES
💰 Dividend Paying: YES
📰 Technical View: *PABC* is currently pulled back from 200 day EMA overall momentum is bullish. Initial resistance lies around 67.50 which break and sustains then secondary resistance lies around 72.50. Use stop loss below 62.50.
PABC is BullishPABC has been in a trending phase since few months and although bears forced a correction, the price still did not dip below previous higher low, which indicates that bulls are still in control of the price action. It is looking good for a bullish rally which could take the price close to 100. Targets are mentioned on the chart.


