PAEL trade ideas
Bullish Breakout in PAEL: Buy on Dip for Short-Term GainsPAEL on the 15-minute timeframe shows a bullish setup with a recent breakout above the 20 EMA and 200 EMA, supported by a noticeable increase in volume—indicating strong buying interest. The current price is around PKR 44.70, and a "buy on dip" strategy is recommended within the 44.00–44.20 range. This setup offers a favorable risk-to-reward ratio, with a stop-loss placed at PkR42.70 and three take-profit targets at PkR 45.47, 46.40, and 47.40. The price has rebounded strongly from the recent low of 42.80, forming a potential trend reversal. Traders should monitor the 44.00 support zone closely, as a sustained hold above it could confirm the continuation toward higher targets.
PAEL SETUP ONCE AGAINPAEL is currently at its orderblock zone where the liquidity is resting if volumes come in at this level then we can expect a bounce again if the orderblock fails and there is no liquidity in OB then wait for downside levels and if the weekly ema 21 is broken then i see 30 level coming but still we will look into some more levels for now just focus on this orderblock
the previous supply is completed here
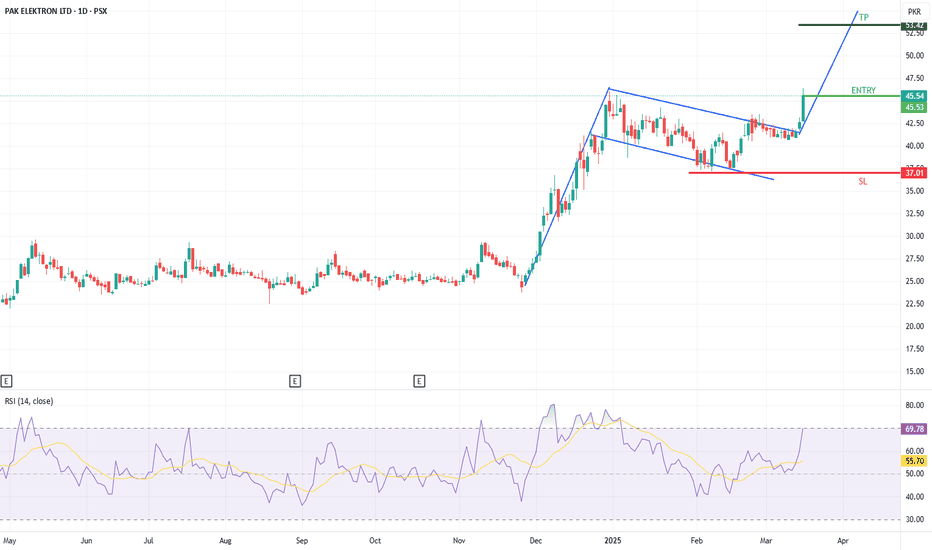
PAEL | Flag PatternThe stock displays a bullish flag pattern on strong volume, trading confidently above both the 20 and 200-day EMAs, suggesting robust upward momentum. Previous session shows a break out of the flag and price closed +3% above it. Initial resistance lies around 46 which is the formation of double top pattern from where short term rejection can be seen. However, a decisive break above the resistance level will confirm the continuation of the bullish trend and flag projection lies around 55.
PAEL - THE BEST SETUPPAEL has always been my favorite stock as it plays very well on price action and technical.
Right now the trending accumulation has ended and its time for a move.
if we take the simple and basic previous demand copy. It gives the target of 60 which everyone is expecting. but there might be some trick played to take out the retails. so be careful around 55 and 59 level you might see the trend slowdown in short term due to divergence on RSI.
right now if you want to accumulate more wait for the intraday retest levels around 46 to 44.
I HAVE ALREADY ENTERED THIS SETUP AROUND 43.
THE TAKE PROFIT IS 55 AND THEN 58 TO 59 ACCORDINGLY.
BULLISH FLAG PATTERN FOR THE PAEL LOVERS The script of PAEL looks in a good shape and forming bullish flag pattern. The price has triggered the breakout and now it seems it will touch the Rs. 60 mark soon.
The share is also fundamentally very strong and in the favorable time of the year to ride the trend.
Earnings, Trendlines, & Cyclic Momentum: PAEL at a Turning PointPre :
PAEL has shown strong financial growth, with Q1 2024 net profit surging 1,090% YoY to PKR 444.9 million, driven by eased import restrictions and market stability. For the nine months ending September 2024, profit after tax rose 97% YoY to PKR 1.863 billion, supported by a 35% revenue increase due to higher sales volumes and price adjustments.
Post :
the stock is trading in rising wedge pattern with support levels at PKR 43.58 and 40.50 and RSI indicates near overbought levels, potential short-term volatility. Main future outlook depends on government upcoming energy policies, increasing home solar systems market demand will intact,
Key on eyes upon 46-levels breaks above levels rally towards 54-58 PKR, aligning with the projected 15-20% gain.
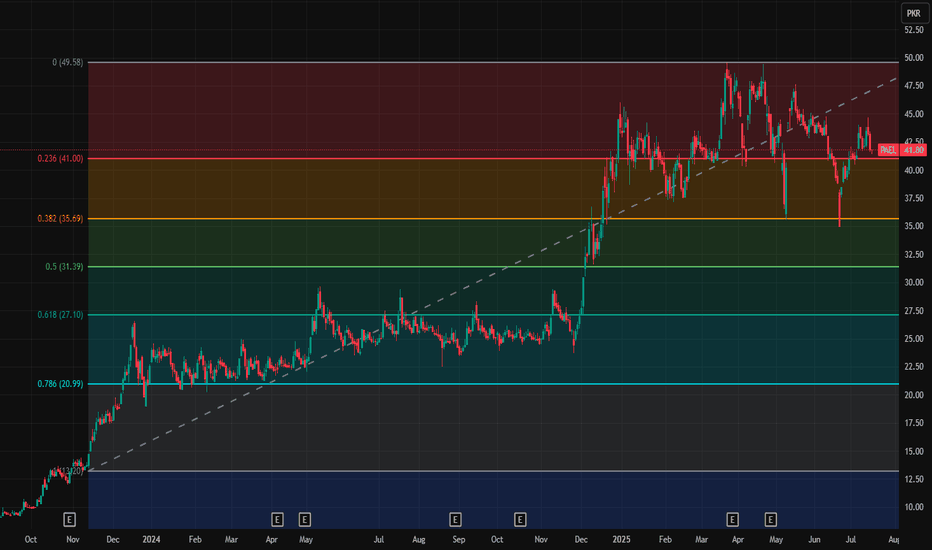
PAEL - PSX - Daily - Technical AnalysisPAEL is in sideways zone. It has established a support zone at Fib 38.20% by bouncing twice from there. Another dip is quite possible. Resistance zone is quite large and it is expected that it may take a month to break across it.
Therefore, Buy on dip will be the way to go.
Trade Values
Buy-1: 38.11
SL: 36.80
TP-1: 43.49
Buy-2: 46.61
SL-2: 43.20
TP-2: 57.10
TP-3: 59.24


