PRL buying StrategyPRL Share Buying Strategy
Key Points:
1. Buying Range: 33-31
2. Stop Loss: 29
3. Target: 39
further hold if close above 39 and sustain
PRL trade ideas

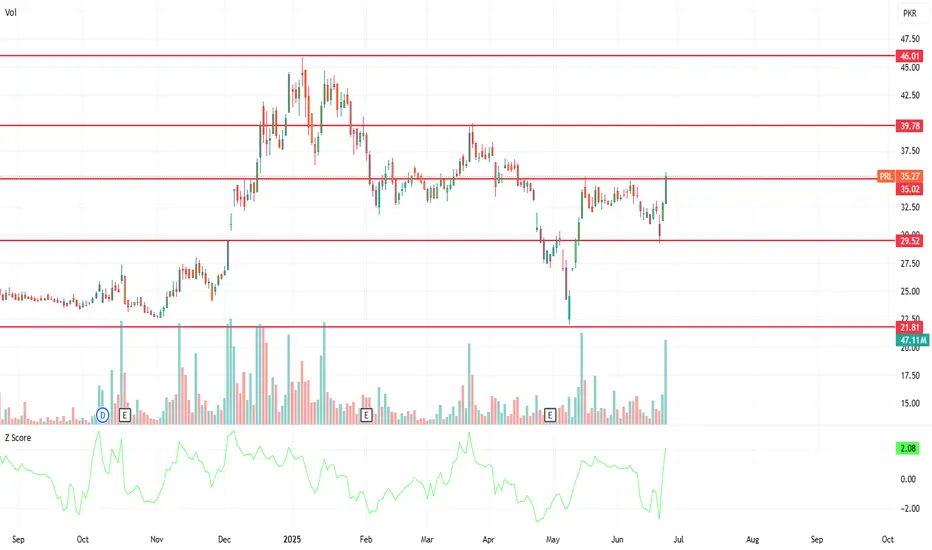
PRL Key levelsPRL key levels are
46.01
39.78
35.02
29.52
21.81
Note: This is not a buy/sell trade call.
Monthly Closing is Important.PRL Closed at 32.21 (20-06-2025)
Monthly closing above 32 - 32.20 would
be a positive sign.
Upside immediate targets can be around 37 -38.
Breaking 31.50 may lead it towards 27 - 28

Bullish
Closed at 34.03 (21-05-2025)
Hidden Bullish Divergence on bigger tf.
Bullish Divergence on shorter tf.
Immediate resistance is around 34 - 34.10
Crossing & Sustaining this level may exposes
upside towards 47 - 48
However, mid way, 40-41 & 44-45 are important
resistances that should not be ignored.
On the flip side, 30 - 32 are important Support levels.
and 29.80 Must not Break on Monthly Basis.


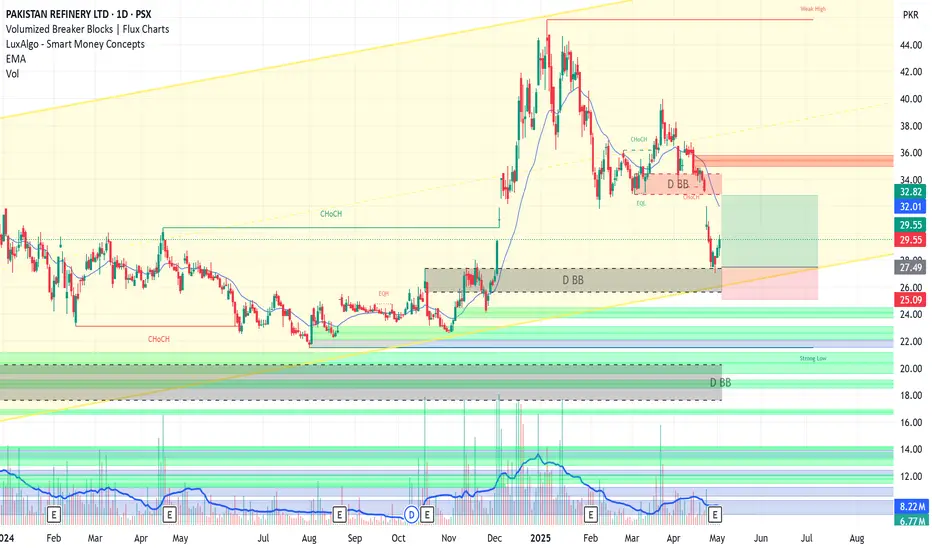
PRL ANALYSISThough PRL is trending in uptrend channel(yellow) in higher timeframe, presently it is in its down leg(pink channel), it has taken support from an important level of 22, it seems going towards higher end of Yellow channel or measured move after breakout from pink channel but there seem two main hurdles in this scenario, biggest is Bearish Breaker Block at 33 and others is still smaller volumes in its current rise from 22.
If PRL gets rejected from 33 then its downside target will be 20.
But on a brighter side if it manages to breakout from pink channel at 35 with heavy volumes only then can it go to target of measured move to 46 and yellow channel top 49
Conclusion: Don't buy at current levels before breakout at 35. In case of previous buying apply SL in case of rejection at 33

PRL LONG TRADEPRL has confirmed its bounce from bottom of upward channel and Breaker Block
It's short term high probability trade
Buy PRL 27.5-29.5
TP 32.8
SL 26.6
No Bearish Divergence on Monthly Tf.No Bearish Divergence on Monthly Tf.
But 39-40 is a Very Strong Resistance
that needs to Cross & Sustain with Good Volumes to
reach 45 - 46 & then 50+
We should not ignore that it has taken Support
from a Very Important Fib level around 32.40
Monthly Closing above 33.60 would be a Very Healthy sign.
So any dip towards 32.50 - 33.50 can be a Buying Opportunity.
However, it should not break 31.80 otherwise we
may witness further Selling Pressure towards 28.50 - 28.70

PRL is gaining momentum for upside movePRL is rising on daily time frame, price is printing higher highs and higher lows
good chance for buying at current level with a define stop loss

Bullish on Monthly TF but..Bullish on Monthly TF.
No Bearish Divergence on Monthly Tf.
But 40 - 40.20 is a Very Strong Resistance
that needs to Cross & Sustain with Good Volumes to
reach 45 - 46 & then 50+
We should not ignore that it has taken Support
from a Very Important Fib level around 32.40
Monthly Closing above 33.60 would be a Very Healthy sign.
So any dip towards 36.50 - 37.50 & then 34.50 - 35.50
can be a Buying Opportunity.
However, it should not break 31.80 otherwise we
may witness further Selling Pressure towards 28.50 - 28.70

PRL WEEKLY CHART TOWARDS 60 ??PSX:PRL
1. Weekly chart suggests that price is working in cup shape.
2. AB:CD pattern is in play since 2023.
3. DEC23 : 35, Dec24: 45
4. Safe bet for PRL with current patterns is 55-60

PRL is at a buy pricePRL is at a buy price and ready to shoot. Taking support from it's trend line and accumulation phase is almost over.

PSX PRL : Entry Points, Targets (Gain 15%--30%)Current Price: PKR 34.18
Entry Point: Around PKR 31 - 33, as this is a key demand zone
First Target: PKR 38 (Short-term resistance level)
Second Target: PKR 42 (Major resistance zone, where selling pressure might appear)
Risk Consideration:
If the stock fails to hold PKR 30, it may enter a further bearish phase.


PRL is in uptrendPRL has taken a due correction and know showing bullish signs perfect entry sign for traders
buying is recommended.

AB=CD Pattern with Bullish Flag: Key Fibonacci Levels in Play!It could be an example of a Bullish Flag.
Why am I posting it?
The reason is to show an example of the AB=CD Pattern, and it currently respected the 61.80% Fibonacci level at 22.17.
If it breaks the 61.80% level on a closing basis (Keeping in mind, it's a Weekly Chart :-) ), it could drop to 18, potentially forming a double bottom. However, if it plays out as expected, the target can be 40+!
Anyhow, I am personally not invested in it—this is just for learning purposes.

Making HH HL on Daily TF.
38.30 can be an Immediate Support level.
However, 35 - 37 is still an Important Support zone.
On the flip side, 41 - 42 is the immediate
Resistance. Ultimate Targets can be around 50.
30 should not be broken, otherwise we may
witness Trend Reversal.

Bullish on All Time Frames.Bullish on All Time Frames.
Immediate Support seems around 34.50 - 34.80
Weekly Closing above 35.10 will trigger more
positivity targeting 37 initially.
Crossing 38.20 may lead it towards 42 - 43

Bullish Trendline Support with Potential Upside Towards PkR27The price recently touched a support level near PkR23, aligned with a rising trendline (orange). Several zones are marked, including potential supply zones (red) around PkR27-29 and a demand zone (green) at PkR22. A forecasted price projection (green line) indicates potential upward movement, possibly reaching the 27-29 range, with a pullback expected afterward.

PRL could drop to 24 and 22 levelsChinese investment news was fake and today's results are negative. These both things hit it hardly, May be it drop to these support levels.

PRL - Trend ReversalPRL trend reversal based on divergence and formation of Higher High. Defined SL, Entry, TP1 and TP2.

Prl - Buy CallPrl - Buy Call
Entry price - Buy above at - 26.05
Stop loss - 21.50
Take profit - 30.40

PRL Bullish Based On Marketwide ActionTechnical Analysis: PRL - Buy Call
* Price Action: Consolidating above ascending trendline.
* Breakout: Potential uptrend above PkR25.55.
* Resistance: Initial at PkR28, intermediate at PkR30, major supply at PkR36.
* Moving Averages: Below 200-day SMA, above 50-day SMA.
* Momentum: Bullish (MACD, RSI).
* Risk Management: Stop loss below PkR23 if trendline breaks.
Overall: Bullish consolidation, potential for uptrend, but risk of downside if trendline breaks.
