Pso bullish flag PSO Chart Analysis – Bullish Flag Formation
Date: July 21, 2025
Ticker: PSO (Pakistan State Oil)
Timeframe: 1W (Weekly Candle)
Chart Pattern: Bullish Flag with Fibonacci Retracement
⸻
🧩 Technical Breakdown
• Massive Uptrend: The chart shows a strong parabolic move from under PKR 150 in late 2024 to nearly PKR 480 by early 2025 — indicating powerful bullish momentum.
• Bullish Flag Formation: After topping around PKR 480, price action has consolidated in a downward-sloping flag channel, marked clearly by two green trendlines. This is a textbook continuation pattern, often signaling further upside after a breakout.
• Fib Retracement Zones:
• Price has respected the 0.382 Fib level (~PKR 340) multiple times as support.
• Currently hovering around PKR 380, just under the 0.236 level, indicating consolidation in a healthy range after the impulse move.
• Lower support zones lie near 0.5 (PKR 300) and 0.618 (PKR 260), which could act as demand areas if the pullback deepens.
• Breakout Projection:
• A potential breakout from the upper flag trendline could push price toward the measured move target of approximately PKR 674.61, as projected in the chart.
• This target aligns with the vertical height of the initial flagpole added to the breakout point.
⸻
📅 Outlook
• If PSO maintains its structure and breaks the upper trendline with volume, it could trigger a strong continuation of the prior uptrend.
• Keep watch on weekly closes above the flag resistance (~PKR 400) for confirmation.
⸻
⚠️ Disclaimer
This chart is for educational and informational purposes only. It does not constitute financial advice. Please conduct your own research before making any investment decisions.
PSO trade ideas

Bullish Flag Pattern.
Bullish Flag Pattern.
Crossing 435 with Heavy volumes will
trigger more positivity & will expose
New Highs targeting 700+
On flip side, breaking 300 now, will
bring more selling pressure.

PSO SHORT TRADEPSO's rally today was just a pullback in its continued downtrend.
Its sharp decline in previous days have caused bearish breaker block around 340 level
SHORT PSO 338-342
TP 296
SL 351

PSO SHORT TRADEPSO is continuing its bearish behavior since many weeks. It re-tested its current breakdown level around 366-370
It is expected to continue its downward trajectory till next support and channel bottom
SHORT PSO 360-370
TP1 335
TP2 325
SL 382

PSO SHORT TRADEPSO failed to post a Higher High in its effort in March 2025
It has broken down its Upward Trendline with heavy volumes
It is expected to continue downward at least till its next support at 325
Short Sell PSO 370-360
TP 325
SL 381

PSO PROBABLY IN WAVE '5' or '4' - LONGPSO is most probably in wave 5 of 3rd wave which can be an ending diagonal or impulse wave.
As the 3rd wave was a big extended wave, 5th wave should not extend and will not make a significant move up.
Volume divergence should also appear between 3rd and 5th wave, further breakup of wave 5 of 3rd: if the count is correct then wave 1 is completed and prices will retrace back to trendline marking wave 2 and only then move forward up.
Alternate count is that we are still in 4th wave, as 4th waves can be any corrective pattern it is not wise to mark them as completed until we see further confirmations. In 4th wave we are in wave B which also can be any corrective pattern.
Our preferred wave count is 5th wave up which will provide a buy opportunity once price retrace back.
Note: We are not trading this move because we already have MARI and POL moves at our hand which are showing more promising returns and have better fundamentals then PSO at the moment.
Feel free to comment and share your thoughts if you like.
Let see how this plays, Good Luck !
Disclaimer: The information presented in this wave analysis is intended solely for educational and informational purposes. It does not constitute financial or trading advice, nor should it be interpreted as a recommendation to buy or sell any securities.

Play on LevelsImmediate Resistance is around 360 - 361
Weekly Closing above this level would be
a +ve sign & may move the price towards 385 - 387

PSO Facing Trendline Resistance – Possible Retracement AheadMollyRonaldFx Report
The PSO 15-minute chart shows a strong bounce from recent lows, with price currently testing a well-defined descending trendline. Although today’s movement reflects bullish momentum (+2.22%), the resistance at this trendline may trigger a pullback. The projected short-term scenario indicates a potential dip towards the 348 support zone. A failure to break and hold above the trendline could confirm this bearish move. Watch price action closely near the resistance area for confirmation.

ABCD Pattern Intact
Monthly Closing above 388 would Trigger
more positivity towards 430 - 440.
465 is Important Resistance.
remember, Crossing & Sustaining 465 with
Huge Volumes may exposes New Highs towards
600+
However, it should not break 320 in
worst case.

PSO - PSX - GANN based Tech AnalysisPSO on Daily TF has been retracing quite a bit. Right now price has just bounced back from Price Action Support Zone. However, a detailed GANN based analysis supported by Fib retracement, RSI and KVO has been performed.
Trade Values
Buy-1: 408
Buy-2: 342
Buy-3: 322
SL: 272

PSO PROBABLY IN WAVE '' C '' OR " 5 " OF CORRECTION - SHORTThis is in continuation to our ongoing tracking of PSO shared earlier in which we are anticipating price to reach 350 - 360 area to go long.
As our MARI trade (long) ended today making reasonable profit freeing our cash and since cash is trash, we have decided to take a small portion of short position in PSO.
If our wave count is correct then we will reach buy zone of 360-350 which will be our target for this short sell trade setup.
Risk/Reward ratio is not so promising on this one but we feel quite confident.
Trade setup:
Entry price: 377.50
Stop loss: 406
Target: 350 - 360
Let see how this plays, Good Luck!
Disclaimer: The information presented in this wave analysis is intended solely for educational and informational purposes. It does not constitute financial or trading advice, nor should it be interpreted as a recommendation to buy or sell any securities.

PSO - LongSimply based on such a long consolidation of 10 years, this stock has huge potential.
If you are a value investor and looking for great returns, then this share is for you with the target of Rs 650.
Short term target for traders is Rs 500-525

Still Good to Go..as Mentioned in Yesterday's Video,
it Hit 430-435 range and closed around 420.
Stoploss for Now 398
It may hit 450 and then 460

No Bearish Divergence so far.No Bearish Divergence so far.
Monthly Closing above 392 would be
a Healthy sign.
It will close as a Morning Star.
On Daily TF, 430 - 435 can be touched easily.
but the real story will start once 465 is
Crossed & Sustained; it may then 500+

PSO - PSX - SWING Trade CallOn daily TF, PSO has broken the falling wedge and now is moving upwards.
Only likely resistance zone is close to previous all-time high.
AB=CD Harmonic pattern has been drawn. KVO is moving upwards indicating bull run with RSI also testing 60.
It is a good opportunity for getting into the SWING trade now spanning over around three months.
Trade Values
Buy-1: 396
Buy-2: 375
SL: 320
TP-1: 446
TP-2: 629

PSOBullish on PSO as because of the bullish flag is formed and broken and price went for its second leg also a resistance is broken!
Price can go near 580 to 600

PSO Showing Strong Signs of Trend Reversal Pakistan State Oil (PSO) appears to be shifting its market structure after a prolonged correction. The most notable signal is that no new lower low was formed, and the previous lower high has been decisively broken, indicating a potential trend reversal. This breakout is backed by a significant rise in volume, suggesting that smart money might be entering the stock. Additionally, RSI has crossed above 60, which reflects growing bullish momentum. Based on this setup, a trade plan could involve a first buy zone around 382–385 (breakout confirmation) and a second buy zone at 360–363 (in case of a pullback). A stop loss below 338 keeps risk defined, while targets at 409 and 445 provide a favorable risk-reward ratio. All key indicators—market structure, volume, and momentum—are aligning to support a potential upward move in PSO. Keep this on your radar, as this could be the beginning of a strong bullish cycle.

PSOPSO Analysis
Bullish Flag formed in daily time frame
No any negative sign showing in daily/weekly/monthly time frames

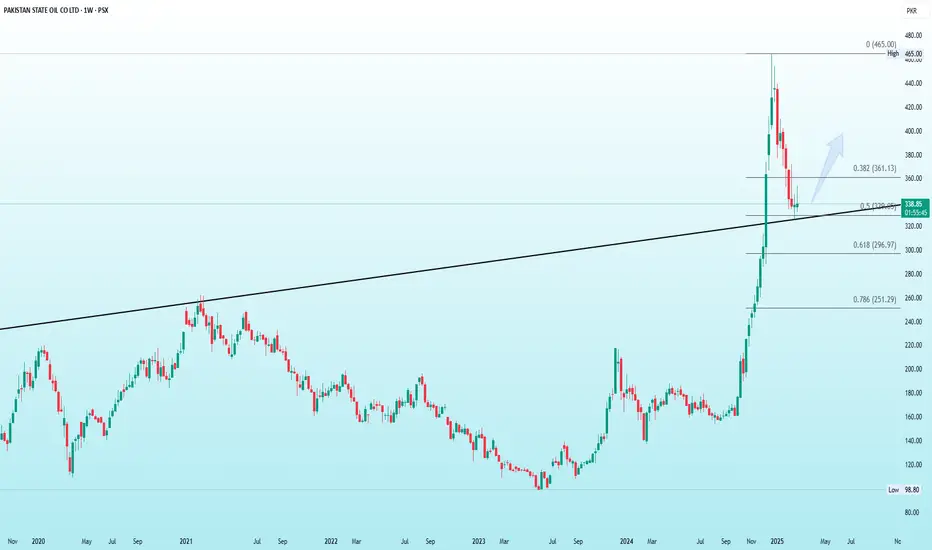
PSO at a Critical Juncture: Uptrend Continuation or Deeper Pull?PSO shows a strong uptrend followed by a significant pullback from its recent peak of 465. The price has retraced to 338, aligning with key Fibonacci levels, with 361 (0.382) acting as resistance and 322 (0.5) providing support near a long-term trendline. Holding above this trendline could signal a continuation of the uptrend, while a break below 322 may lead to further downside towards 296 (0.618 retracement) or even 251 (0.786 retracement). A bullish recovery would require reclaiming 361, while failure to hold support levels could extend the correction. Overall, the trend remains bullish in the long run if the price stays above key support zones.
PSO could drop todayPSO is cross below my created indicator may be it drop below to 340 and 340. Wait for it to entre bullish zone.
Note: This is not a buy sell call, trade at your own will and use stop loss.


PSO at 50% Retracement - Buy OpportunityPSO is currently trading at a 50% retracement level of its ongoing bullish leg. This presents a strong buying opportunity, with the target set at the recent top.

LongIt should not break 334.
upside targets are around 390 & then above 400.
If 465 is Crossed & Sustained, we may witness 600+
