PSO OPERTUNITIESKey Observations:
Price Levels and Support/Resistance:
Current Price: The price is currently at 379.01 PKR.
Support Levels:
Major support is visible at 375.42 PKR, marked in blue.
Below that, there’s another potential zone near 372 PKR.
Resistance Levels:
Key resistance appears around 382.77 PKR.
Another significant resistance lies at 389.67 PKR, with the next level at 403.95 PKR.
Moving Averages:
The chart features two moving averages:
Green (Longer-term MA, possibly 200-period): Indicates a downward trend as the price is below this moving average.
Orange (Shorter-term MA, possibly 21-period): This MA shows a more reactive trend but is currently sloping downward, suggesting short-term bearishness.
Indicators and Tools:
LuxAlgo Patterns: The chart includes LuxAlgo's supply and demand zones:
A highlighted demand zone (red shaded region) suggests buyers' interest around 372 PKR.
The supply zone above 389 PKR shows selling pressure in that region.
Volume: Increasing volume spikes during drops indicate selling pressure.
Overall Trend:
The price has been in a downtrend, indicated by lower highs and lower lows.
However, recent price action near support levels shows potential consolidation.
PSO trade ideas

PSO: An opportunity to have a quick Profit.After a marathon rally up to 465 the security made a retracement to the fib. level of 0.5 and now it has the shown the signs of reversal.
Such are the good opportunity to make quick money. All the parameters of trade i.e. entry, SL and TP has been marked on the chart. You may trade accordingly.
Pl do tell me your opinion as learning is both ways.

PSO - PSX - Price action, GANN, Fib, RSI and KVO based analysisPSO on Daily TF has been retracing quite a bit. Right now price has just bounced back from Price Action Support Zone. A detailed GANN based analysis supported by Fib retracement, RSI and KVO has been performed.
Trade Values
Buy-1: 408
Buy-2: 342
Buy-3: 322
SL: 272

PSO - 17% Quick Gainimmediate entry can be taken with SL around 377 for first TP of 453 and second TP of 491

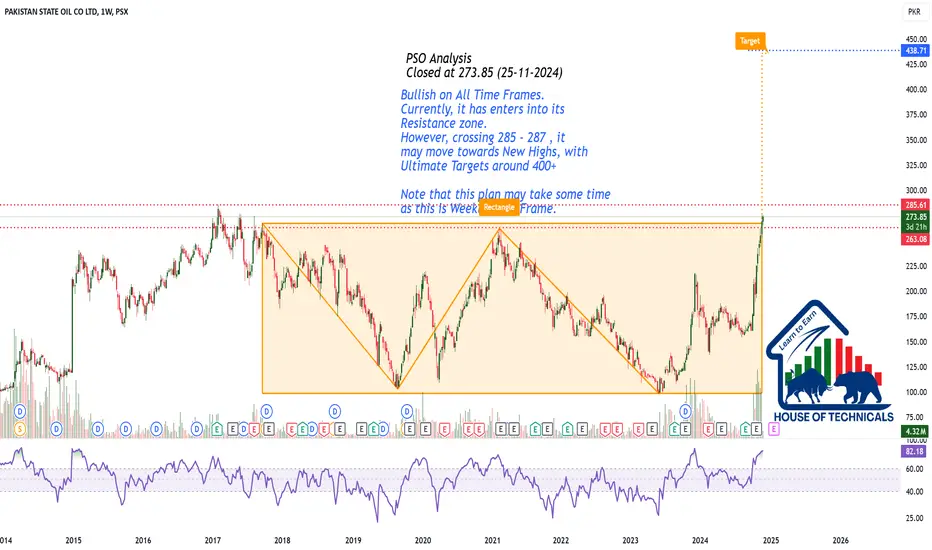
Bullish on All Time Frames.Bullish on All Time Frames.
Currently, it has enters into its
Resistance zone.
However, crossing 285 - 287 , it
may move towards New Highs, with
Ultimate Targets around 400+
Note that this plan may take some time
as this is Weekly Time Frame.
All Targets achieved on PSO!PSO Call was initiated on 25 Oct'24 at the breakout of 225, however, could not be published due to unpaid account.
78% gains as per the projections have been achieved within 2 months.
Swing traders should close their trades here, however, those wish to ride the trend can still hold it with Stop loss at 288

PSO - KSE100 - end of bullish trend?PSO is currently in a bullish trend and has completed an AB=CD pattern. The price is now testing a weekly resistance zone of 259-268, suggesting a potential healthy retracement in the near term.
The next favorable buying zone is anticipated around 210-220. For current buyers or holders, a stop-loss at 245 is recommended to manage risk.

Bearish Divergence on PSOA bearish divergence is appearing on the PSO Daily time frame which is indicating a price correction


Favoring BullsNegative Point: Bearish Divergence on Daily TF
Bullish Points:
Morning Star Formation on Daily TF.
Bullish on All Time Frames
Sustaining above Strong Resistance area (218 - 219);
this may act as Support now.
Immediate Resistance area : 249 - 260
Immediate Support area : 217 - 221
We may witness 290+ if 270 - 275 is Crossed

PSX:PSO ABCD Pattern CompleteABCD Pattern Complete
Divergence on RSI
Can retrace reached PRZ
Can retrace to 216-222 Range on Fib


PSO | Cup&Handle PatternThe chart depicts the stock price movement of Pakistan State Oil (PSO) Ltd on a daily timeframe. It shows the formation of a cup-and-handle pattern, a bullish reversal pattern. The "cup" part indicates a gradual downtrend followed by a recovery, and the "handle" suggests a brief consolidation. The price is currently in the handle formation, and the key levels to watch are the target points (TP1: 170.90, TP2: 177.50, and TP3: 185) based on the expected upward breakout. However, there's a potential downside risk with a support level around 156. If the price breaks below this support, it could invalidate the bullish setup.

PSO outlookAs the previous market data is concerned the data for PSO shows us a fall in the price of share i am watching ptice to fall to its weekly support level and the price gauge to 155.68 level of support , as well as the trend is concerned stock is in a bearish trend from weekly to daily to H4 to H1 there is some resistance to bearish trend over H4 TF but main trend is breaish price is also forming a Continuation pattern to the bearish trend i am bearish over next week to 155.88 level of support

PSX: PSO OutlookPSO look has breakout the trend which is confirming the bullish divergence trend reversal. looks good for short term and long term entry.
Entry: 169
SL: 154
TP1: 184
TP2: 200
TP3:215

PSO Upward momentum buildingScrip Analysis with viable anticipated viable Profit Targets and also hopeful to materialize soon as well. Lets c how it plays...

PSO - BULLISHPSO is currently in a bearish trend on 1hour chart,
divergence was printed there's a possibility of reversal from this zone
long entry is recommended

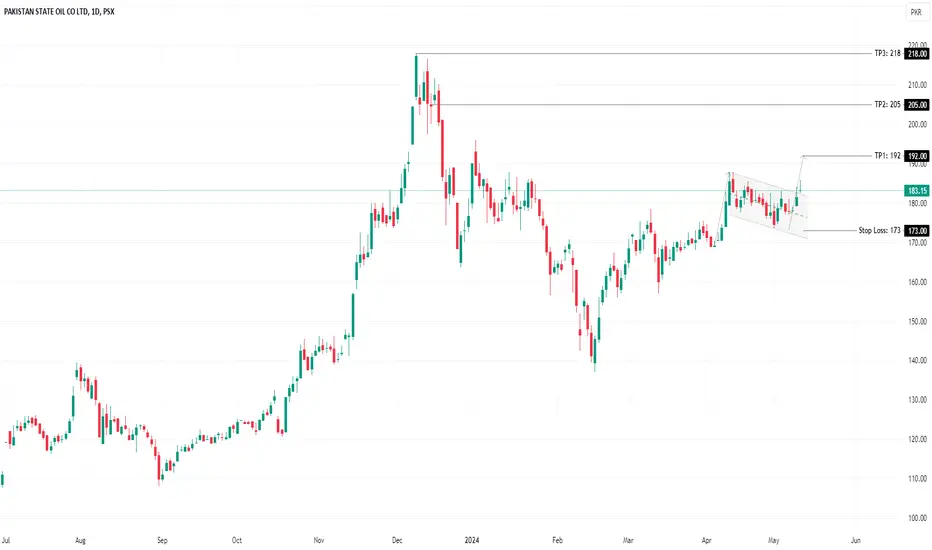
PSO | Flag Pattern🚀 Stock Alert: PSO
📈 Investment View: Technically Bullish 📈
🔍 Quick Info:
📈 Buying Range : 183-184
🎯 First Target : 192
🎯 Second Target : 205
🎯 Third Target : 218
⚠ Stop Loss: 173
⏳ Nature of Trade: Mid Term
📉 Risk Level: Medium
☪ Shariah Compliant: YES
💰 Dividend Paying: YES
📰 Technical View: PSO displays a promising bullish pattern characterized by the formation of flag pattern. Our plan entails accumulating the stock within the designated buy zone (183-184 range), while setting stop loss orders below the bottom of flag at 173 to manage risk effectively. Anticipation builds for a substantial surge in momentum upon the completion of flag around the 192 area. To guide our trading decisions, we've delineated two more distinct targets: an intermediate target around 205 and a final target for exiting the trade will be around 218 which acts as a major resistance level.
Bearish divergence in PSOA bearish divergence is observed in PSO in a daily timeframe. The trend has reversed from bullish to bearish by breaking the last HL and forming the first LH. The bearish trend is expected to continue forming new LHs and LLs. If the bearish trend continues forming a new LH. then it will be a good point to take a short position as per the levels indicated on the chart.

PSO:PSX Buy CallPSO printed a Bullish Divergence with a Falling wedge pattern suggesting a Bullish shift in momentum.
Market entry is suggested with Stop Loss on previous Lower Low. Take profit levels are recommended on 1:2 Risk Reward Ratio.
Happy Trading!

PSO - BAT PATTERNAfter a bearish trend, PSO has reversed its trend , there is a divergence on RSI too and a good bullish move is expected. Long entry recommended.

PSO - KSE100- Possible set up.PSO is currently in the Fibonacci golden pocket and above the support level of the previous high. If the price breaks out above 185.70, it can test the 200 level and then 213. If the price breaks down to 174, then it might retest the 145-150 level.
