Taking Support from a Strong Trendline
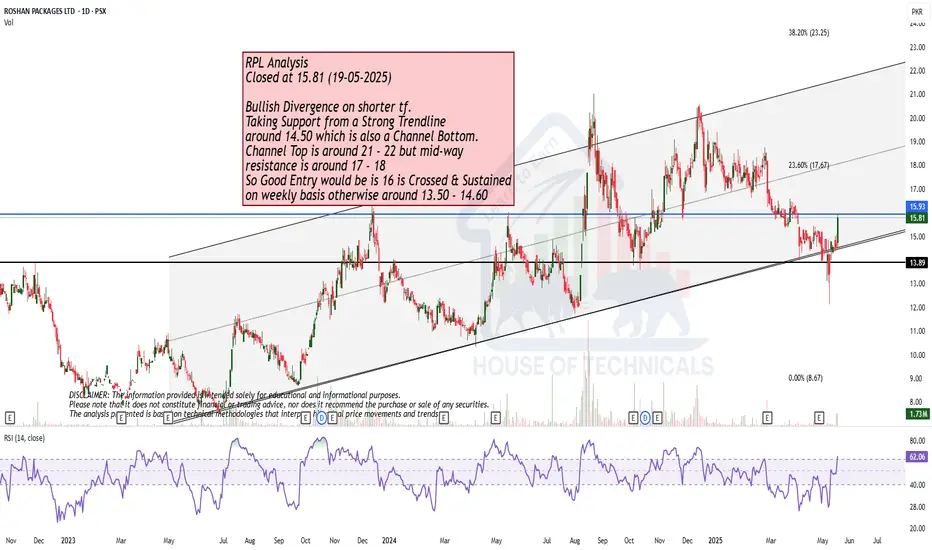
Bullish Divergence on shorter tf.
Taking Support from a Strong Trendline
around 14.50 which is also a Channel Botom.
Channel Top is around 21 - 22 but mid-way
resistance is around 17 - 18
So Good Entry would be is 16 is Crossed & Sustained
on weekly basis otherwise around 13.50 - 14.60
RPL trade ideas
RPL - LongLooking good as the weekly trendline is broken. In a bullish market, this share needs to catch up so I am giving this long call based on market psychology. Do your own research
TP 1: 21.2
TP2: 22.3
Tp 3: 24

RPL PSX ( ROSHAN PACKAGES)RPL returned after made High of
20.54 and
is bounced from Fibonacci Golden Zone
and broke and retest from retracement line and expected to go up with first Target 🎯Price can be 20.54
Stopp Loss should be: 17.57
Fundamentally it earned profit 112M in FY-25-1Q (348% plus SPLY).

RPL - PSX - Technical AnalysisRPL is following Bat Pattern. If it continues to follow it (91% chances) then it is going to test 15.80 first and then will test 15.00 and then 13.20 and eventually 10.75 .
And if it does not then it will bounce back from Orange line which is weekly support line.

RPL-LONGRPL is trading in a bullish trend and now retraces from 0.786 fib ratio and 200 MA,so we will take a long trade here

The Downtrend Is Over, 50% Potential AheadRPL looks attractive as its already on lower side from its top of 22.44, next accumulation zone lies around 16 and if it follows the same pattern of Higher Highs & Higher Lows then potential upside towards 24 gives 50% gain. This is a swing trade setup and can take time to give this much return or may be early. Use stop loss at 12 to manage risk, entry at 16 if reaches only, and set sell limit at 24. Manage your risk accordingly.

RPL is BullishPrice was in a strong downtrend, but it has given a good breakout and is consistently printing higher highs followed by higher lows, if the trend continues we can expect good bullish rally in coming months. Targets are mentioned on the chart.
P.S This analysis is conducted on weekly time frame, and could take months to play out

RPL is BullishRPL is moving in an uptrend, however it is currently undergoing a correction, it is breaking a lower high which is a good sign, but it could dip a bit further to make bullish divergence, which would further validate a bullish move. Entry point and targets are mentioned on the chart.

PSX KSE 100 ROSHAN PACKAGES RPL 1- Breakup of weekly Trend
2- Volume Increasing day by day
3- Fibonacci retracement also done
4- Hopefully it will get Target
5- Facing resistance at 17.43 and completing resistance at 0.382 at 15.45
6- trend is UP

clear HH and LLHH and LL on time frames of 1D, 4H and 1W indicate decent upside for trail, till the structure breaks

PSX -RPL OutlookRPL is making higher high and higher low after breakout the LH. today session closed with Bullish Marubozu candle with healthy volume. Entry is recommend 15.65 level.
Entry: 15.65
SL: 12.25
TP1:19.05
TP2:22.42

