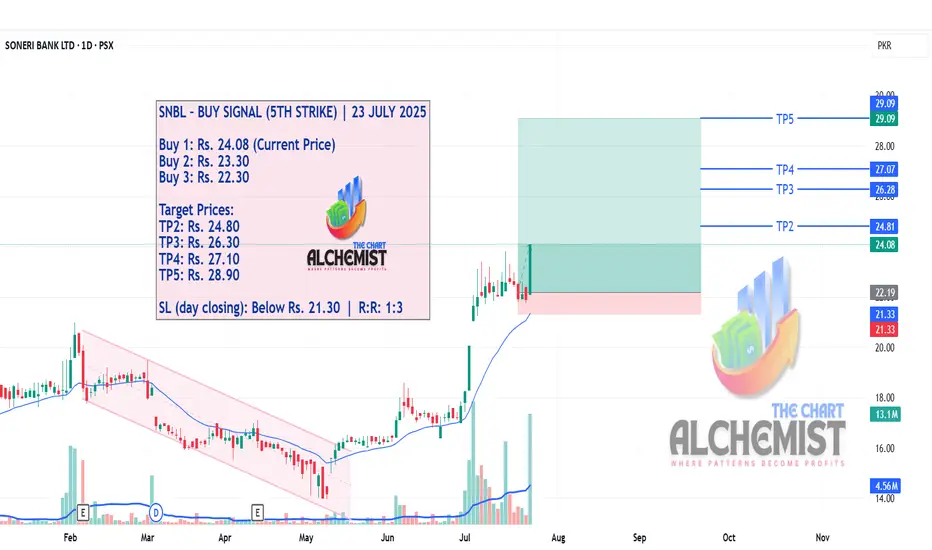
SNBL – BUY SIGNAL (5TH STRIKE) | 23 JULY 2025SNBL – BUY SIGNAL (5TH STRIKE) | 23 JULY 2025
After successfully achieving all targets of the first three strikes and TP1 of the fourth strike, SNBL now presents a fresh opportunity for a 5th strike. The stock continues to follow its upward trajectory, and the current bullish structure justifies another long entry setup targeting higher displacement levels.
SNBL trade ideas
SNBL PROBABLY IN WAVE ' Z ' OF B or CThis is in continuation of our ongoing tracking of SNBL wave structure, prices have broken above the 22.50 level indicating one more leg upwards.
Currently the price is unfolding as wave Z which will target 26 - 28.50 zone, however the prices should decline towards the 20.70 - 19.80 level (buy zone) before rising again.
If the prices go below the 18.60 level, it will significantly weaken this wave count. we will only activate this trade if price reach our buy zone.
If the wave count is correct then this trade will provide us minimum 25.60% gross gain.
Trade Setup:
Entry level: 20.70 - 19.80
Stop loss: 18.59
Target: 26 - 28.50
Let see how this plays, Good Luck!
Disclaimer: The information presented in this wave analysis is intended solely for educational and informational purposes. It does not constitute financial or trading advice, nor should it be interpreted as a recommendation to buy or sell any securities.

SNBL PROBABLY IN WAVE 'C' OF B or 2SNBL is most probably in wave C of wave B or 2
If our wave count is correct then we are in wave 1 of wave C which will target 13.60 - 13 range but first it has to take out the below teal color trendline, there is a possibility that prices might start rising taking support from this trendline starting wave 2 but most probably prices will go down to 13.60 - 13 level.
This count of bearish wave C remains valid until prices goes above 22.50, once price breach 22.50 we will enter long position targeting 29.20 which aligns with our alternate count.
We are looking to take 2 trades out of this setup, first will be a long position as wave 2 & once wave 2 gets completed, we will enter short sell position as wave 3. Will share trade setups in due course.
We are bearish on SNBL and our preferred wave count target is 7.80 - 6.50 range on the long term charts.
Let see how this plays, Good Luck!
Disclaimer: The information presented in this wave analysis is intended solely for educational and informational purposes. It does not constitute financial or trading advice, nor should it be interpreted as a recommendation to buy or sell any securities.

SNBL is ready to flySNBL is breaking breakout level of 15.07 and it is going to 16 and 17 levels. This is not a buy/sell call. Use Stop loss too.

SNBL | Swing Setup🚀 Stock Alert: SNBL
📈 Investment View: Technically Bullish 📈
🔍 Quick Info:
📈 Entry Range: 9.50 - 9.70
🎯 First Targets : 10.50
🎯 Second Targets : 11.70
⚠ Stop Loss: 8.50
⏳ Nature of Trade: Swing
📉 Risk Level: Medium
☪ Shariah Compliant: NO
💰 Dividend Paying: YES
📰 Technical View: The price pulled back from its trend line support and currently trading around 9.70. Initial resistance lies around 10.50 and secondary resistance around 11.70. Use stop loss at the break of 8.50.
