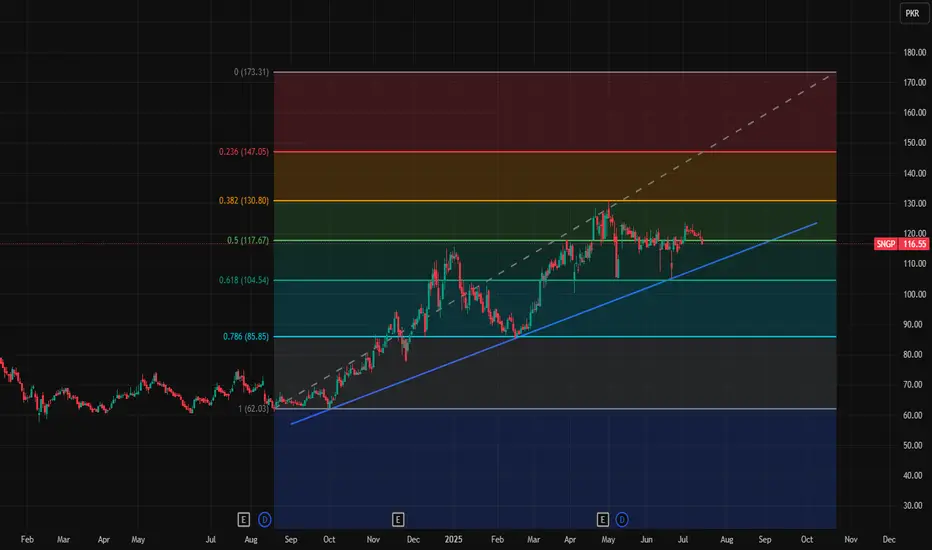
SNGP in long runThis is SNGP daily chart and blue trend line shows its positive movement and it is maintaining sustainable growth.
These are key levels 117.67, 130.8, 147.05 and 173.31
Note: This is not a buy/sell trade call, it is an analysis.
18.98 B PKR
1.53 T PKR
345.11 M
About SUI NORTHERN GAS PIPELINES LTD
Sector
Industry
CEO
Amer Tufail
Website
Headquarters
Lahore
Founded
1963
ISIN
PK0008901016
FIGI
BBG000GNJ6L4
Sui Northern Gas Pipelines Ltd. engages in purchasing, transmission, distribution, and supply of natural gas. . It operates and manages high pressure gas transmission and distribution systems. It is also involved in planning, designing, and constructing pipelines for other organizations. The company was founded on June 17, 1963 and is headquartered in Lahore, Pakistan.
Related stocks
Bearish Divergence played wellSNGP Analysis
Closed at 117.34 (29-05-2025)
Bearish Divergence played well & dragged the
price from 129 -130 towards 113.
Now, Seems like HL has been printed around 113 - 114.
If this level is broken, we may witness further downside
towards 102 - 107
Immediate Resistance is around 123 - 125 & then

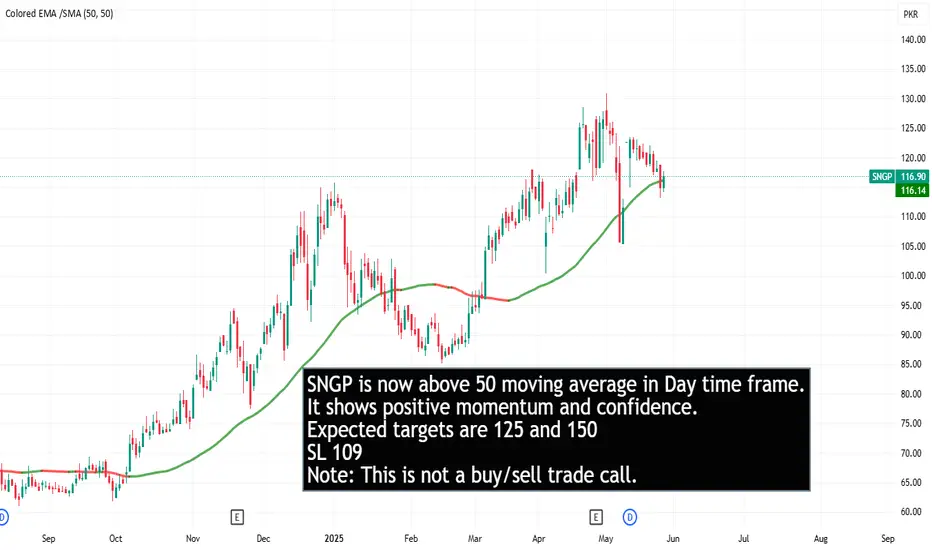
SNGP is ready to fly. SNGP is now above 50 moving average in Day time frame. It shows positive momentum and confidence. Expected targets are 125 and 150
SL 109
Note: This is not a buy/sell trade call.

SNGP buying StrategyBuy Recommendation:
- Current Price: Rs. 124.94
- Suggested Buy Range: Rs. 123-118 (on dip)
- Stop Loss: Rs. 116
- Target Price: Rs. 135

SNGP IS ON THE RISESNGP is rising despite of the fact that market is in pressure, price has taken a good correction and now showing bullish signs, buying is a good option at current price.

Bearish Divergence appeared.Bearish divergence appeared on Daily as well as
Weekly TF.
Strong resistance is there around 127 - 129.
Once this level is Crossed, we have open ways
towards 145 - 147
On the flip side, we have a good support around
120-122. However, breaking 116 this time will bring
more selling pressure towards

After Making HH, now towards HL.
After Making HH, now towards HL.
Bearish Divergence is there, so dragging
the price down.
115 - 118 can be a Good Support level.
Couple of Green candles may confirm HL
at this area.
However, if 110 is broken, we may
witness further Selling pressure.

SNGP | GRAVESTONE DOJIThe daily chart of SNGP shows a strong bullish trend that recently pushed the stock to new highs, but a potential reversal signal has emerged. A Gravestone Doji has formed near the top, a bearish candlestick pattern that suggests buyer exhaustion and possible trend reversal. This is particularly sig

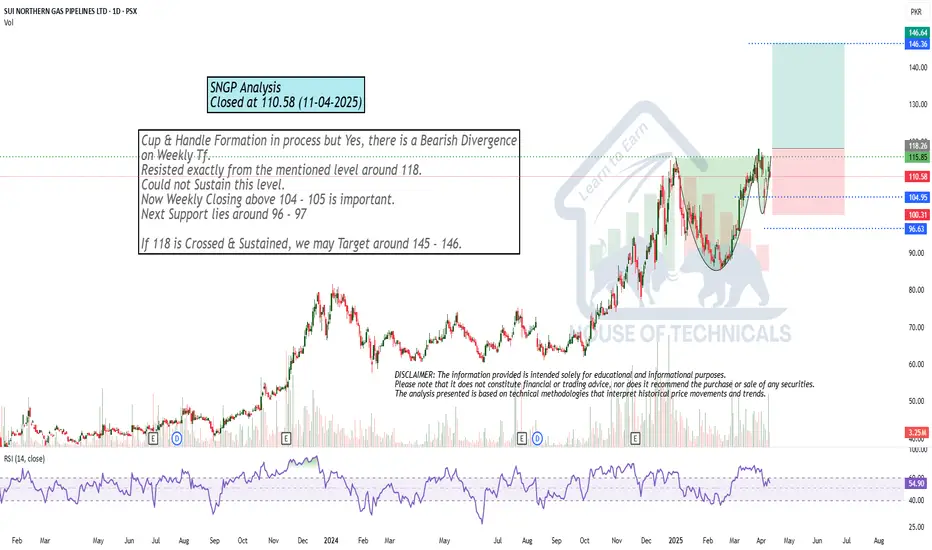
Cup & Handle Formation in process but Cup & Handle Formation in process but Yes, there is a Bearish Divergence
on Weekly Tf.
Resisted exactly from the mentioned level around 118.
Could not Sustain this level.
Now Weekly Closing above 104 - 105 is important.
Next Support lies around 96 - 97
If 118 is Crossed & Sustained, we may Target a
See all ideas
Summarizing what the indicators are suggesting.
Neutral
SellBuy
Strong sellStrong buy
Strong sellSellNeutralBuyStrong buy
Neutral
SellBuy
Strong sellStrong buy
Strong sellSellNeutralBuyStrong buy
Neutral
SellBuy
Strong sellStrong buy
Strong sellSellNeutralBuyStrong buy
An aggregate view of professional's ratings.
Neutral
SellBuy
Strong sellStrong buy
Strong sellSellNeutralBuyStrong buy
Neutral
SellBuy
Strong sellStrong buy
Strong sellSellNeutralBuyStrong buy
Neutral
SellBuy
Strong sellStrong buy
Strong sellSellNeutralBuyStrong buy
Displays a symbol's price movements over previous years to identify recurring trends.
Frequently Asked Questions
The current price of SNGP is 116.43 PKR — it has increased by 0.52% in the past 24 hours. Watch SUI NORTHERN GAS PIPELINES LTD stock price performance more closely on the chart.
Depending on the exchange, the stock ticker may vary. For instance, on PSX exchange SUI NORTHERN GAS PIPELINES LTD stocks are traded under the ticker SNGP.
SNGP stock has fallen by −1.33% compared to the previous week, the month change is a −2.08% fall, over the last year SUI NORTHERN GAS PIPELINES LTD has showed a 59.62% increase.
We've gathered analysts' opinions on SUI NORTHERN GAS PIPELINES LTD future price: according to them, SNGP price has a max estimate of 145.40 PKR and a min estimate of 145.40 PKR. Watch SNGP chart and read a more detailed SUI NORTHERN GAS PIPELINES LTD stock forecast: see what analysts think of SUI NORTHERN GAS PIPELINES LTD and suggest that you do with its stocks.
SNGP reached its all-time high on May 31, 2017 with the price of 185.00 PKR, and its all-time low was 15.92 PKR and was reached on Apr 16, 2013. View more price dynamics on SNGP chart.
See other stocks reaching their highest and lowest prices.
See other stocks reaching their highest and lowest prices.
SNGP stock is 0.92% volatile and has beta coefficient of 0.97. Track SUI NORTHERN GAS PIPELINES LTD stock price on the chart and check out the list of the most volatile stocks — is SUI NORTHERN GAS PIPELINES LTD there?
Today SUI NORTHERN GAS PIPELINES LTD has the market capitalization of 73.84 B, it has decreased by −1.94% over the last week.
Yes, you can track SUI NORTHERN GAS PIPELINES LTD financials in yearly and quarterly reports right on TradingView.
Yes, SNGP dividends are paid annually. The last dividend per share was 7.50 PKR. As of today, Dividend Yield (TTM)% is 10.31%. Tracking SUI NORTHERN GAS PIPELINES LTD dividends might help you take more informed decisions.
SUI NORTHERN GAS PIPELINES LTD dividend yield was 18.91% in 2024, and payout ratio reached 40.11%. The year before the numbers were 11.43% and 27.02% correspondingly. See high-dividend stocks and find more opportunities for your portfolio.
As of Jul 27, 2025, the company has 8 K employees. See our rating of the largest employees — is SUI NORTHERN GAS PIPELINES LTD on this list?
Like other stocks, SNGP shares are traded on stock exchanges, e.g. Nasdaq, Nyse, Euronext, and the easiest way to buy them is through an online stock broker. To do this, you need to open an account and follow a broker's procedures, then start trading. You can trade SUI NORTHERN GAS PIPELINES LTD stock right from TradingView charts — choose your broker and connect to your account.
Investing in stocks requires a comprehensive research: you should carefully study all the available data, e.g. company's financials, related news, and its technical analysis. So SUI NORTHERN GAS PIPELINES LTD technincal analysis shows the sell today, and its 1 week rating is buy. Since market conditions are prone to changes, it's worth looking a bit further into the future — according to the 1 month rating SUI NORTHERN GAS PIPELINES LTD stock shows the strong buy signal. See more of SUI NORTHERN GAS PIPELINES LTD technicals for a more comprehensive analysis.
If you're still not sure, try looking for inspiration in our curated watchlists.
If you're still not sure, try looking for inspiration in our curated watchlists.