SSGC – BUY SIGNAL | 01 AUGUST 2025SSGC – BUY SIGNAL | 01 AUGUST 2025
The stock recently broke out of a bearish channel (marked light pink) and made a high of Rs. 47.41. Since the breakout, it has been undergoing a lateral pullback, which now appears to be complete based on the volumetric profile and recent price action. With momentum shifting back in favor of buyers, SSGC is poised for the next leg upward.
SSGC trade ideas

SSGC DTFIndicators are showing weakness but one indicator is indicating that slow and gradual accumulation is going on and the Scrip can take a turn towards the upside. Keep fingers crossed and place on watchlist to track movement.

SSGC DAILY CHART BUYING OPPORTUNITY41.50 is a good price to buy SSGC. This analysis is sharing for educational purpose only.
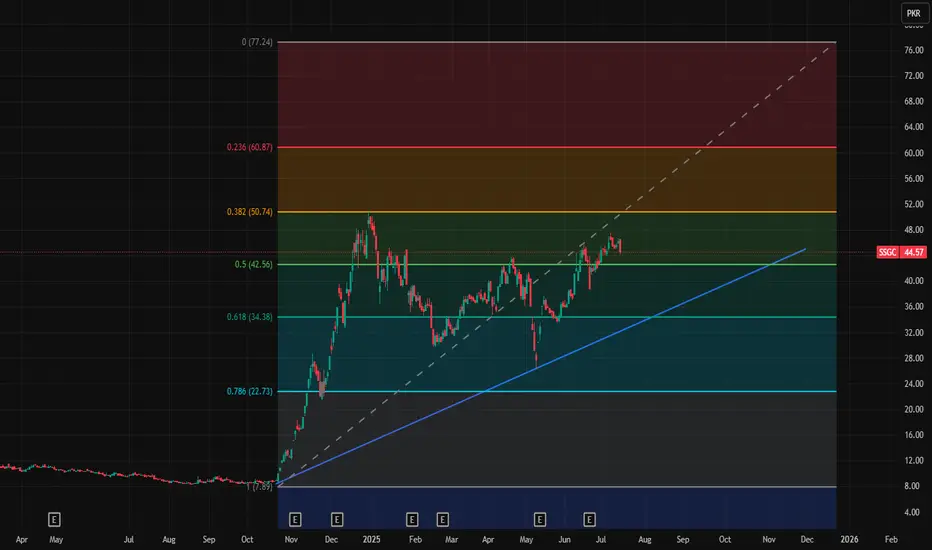
SSGC trendThis is SSGC daily chart and you can watch blue trend line is its strong support and sustainability. It is growing day by day in long term.
These are key levels 34.38, 42.58, 50.74, 60.87 and 77.24
Note: This is not a buy/sell trade call. It is an analysis.
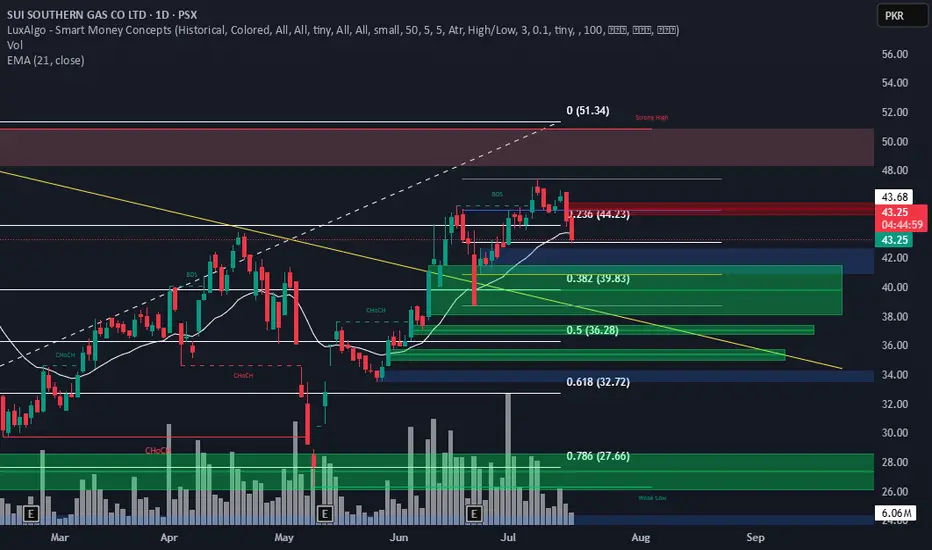
SSGC has completed its retracementSSGC has completed its retracement, and now moving in a bullish channel

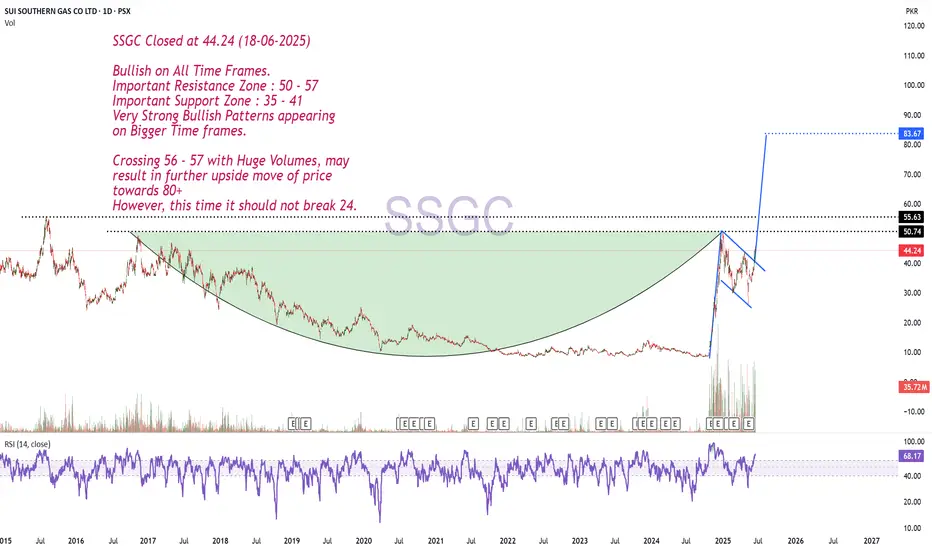
Bullish on All Time Frames.SSGC Closed at 44.24 (18-06-2025)
Bullish on All Time Frames.
Important Resistance Zone : 50 - 57
Important Support Zone : 35 - 41
Very Strong Bullish Patterns appearing
on Bigger Time frames.
Crossing 56 - 57 with Huge Volumes, may
result in further upside move of price
towards 80+
However, this time it should not break 24.

SSGC | Wycoff In PlayTheory of Wycoff has been observed in the Sui Southern Company chart.High volumes have been generated on top which can be described as distribution phase.And low volumes have been observed at bottom which can be termed as accumulation phase.

SSGC is near breakout level. SSGC is near to daily 50 moving average at (37.22) and it is breakout level too. It is expected to cross 51 and 64.7 level in few weeks. SL is 31.9
Note: This is not a buy/sell trade call.


No Payout but..
Though NO PAYOUT, but Very Good Result.
If 31.50 is Sustained, we may witness 34-35
tomorrow.

Hidden Bullish Divergence will play?as mentioned during market
timings, 36.50 was important to
sustain. It could not and hit the
Lower Lock at 36.03
Next Support is around 34.50 - 34.62
Now it is Important to Sustain 36.50 - 36.70
on Weekly basis.
Monthly Support is around 35.
One +ve sign: Hidden bullish divergence has
also appeared.

SSGC LONG TRADESSGC has rebound from trendline, it's continuously in uptrend
Buy SSGC 39-41
TP 44.5
SL 37.9

Bullish on bigger time frames.
Bullish on bigger time frames.
Took support from a very important
level around 36-37.
HL printed.
40.30 - 40.85 is a Resistance level as
of now.
If it gets rejected from this level, we may
witness 37.50 - 38.50 again.
Upside targets can be around 45 - 46 & then
50s.

Channel bottom Support Taken...Important to Close above 40.84
on Monthly Basis for further
Upside.
Channel top is around 44 - 45

SSGC | Downward-Sloping ChannelThe stock in a downward-sloping channel after a strong rally that peaked near PKR 50.87. Currently trading at PKR 39, the price is above the 200 EMA level (28.70 PKR), suggesting longer-term bullish strength despite short-term weakness. Recent price action faced resistance near the upper trendline, and today's bearish candle indicates selling pressure. Key support lies around 37.00–35.00 PKR, while a breakout above 41.00–43.00 PKR could signal a resumption of the uptrend if backed by strong volume.

SUI SOUTHERN GAS CO LTD SSGS has good potential to grow more because of current government in Pakistan try their best resolve the issue of circular debt SSGS is the one of beneficiary of circular debt.
1) Currently SSGS share price following Dow theory of uptrend.
2) Volume on daily time frame showing strong sentiment for future grow.
3) Completed 50% retracement of fib`s , Show strong reverse from golden number of fib.
4) Following AB:CD pattern on daily, weekly and monthly time frame, while completed (C) leg of AB:CD pattern and started to follow ( D) leg.
5) Also seen cup & handle pattern of daily, weekly time frame, currently following to complete handle of cup and handle pattern.
6) According to Elliot impulse theory completed 2nd leg and started 3rd leg which can expect more higher than past one.
Trade Plane
AB:CD Pattern Targets
Target (1) : 50.54
Target (2) : 72.00
Stop loss : 29.80
Cup & Handle Targets
Target: 89.45

SSGC-LONGif it sustain above 41 and continue its positive momentum rather than any bearish signal so it will move towards target IN JUNE 2025 OR JULY 2025.

SSGC PSX Stock SummarySSGC (Sui Southern Gas Company) on the Pakistan Stock Exchange (PSX) is showing positive momentum, with a near-term target of PKR 43.90. The recommended entry is at the current market price, with a stop loss set at PKR 40.00 to manage downside risk. The stock appears poised for an upward move based on recent trading activity and technical indicators.
Disclaimer: This summary is for informational purposes only and does not constitute financial advice or a recommendation to buy or sell any securities. Please conduct your own research or consult with a licensed financial advisor before making investment decisions. Trading in stocks involves risk, including the potential loss of capital.

SSGC-PSX, A Good Probability Buy TradeConfluences include:
1. Support of Anchored VWAP
2. EMAs Channel
3. TL Breakout with sustained volume AFTER Breakout
4. Tendency of Price to test ATH level with a good momentum.

#Ssgc is above green sky (strong bullish zone)#Ssgc is now above green sky (Strong bullish zone). It is expected to cross 45 and 60 level.
Note: This is not a buy or sell call, trade at your own will. Use stop loss as per your strategy.

Buying Opportunity - SSGCSSGC give a buying opportunity for LONG.
buying range 39-37
Stop Loss - 36
Target 1: 44
final target 50

SSGCA rising wedge or ascending channel is forming.
A descending channel target is marked at 25.80 PKR in case of a breakdown.
Key Price Levels & Trade Strategy:
Safe Buying Zone: Above 39 PKR if sustained.
Take Profit (TP) Levels:
First TP: 44.40 PKR
Second TP: 48.25 PKR
Long-term TP: 50 PKR (if a bullish divergence forms and price breaks upward).
Relative Strength Index (RSI): Displayed below the price chart.
RSI appears to be declining after a peak, which could indicate a potential pullback or consolidation.
Interpretation:
Bullish Scenario: If the stock sustains above 39 PKR, it could rally toward 44.40 PKR and 48.25
Bearish Scenario: If it fails to sustain and breaks below support, it could drop towards 25.80
