SYS Analysis 2.0 (Long) SWING🚀 Trade Alert: SYS Double Bottom Reversal Pattern 🚀
We have identified a textbook trading opportunity in SYS, marked by the following bullish pattern:
Double Bottom Reversal Pattern ⏬⏫
Entry Point:
Place your entry at the Lower High (LH), with the neckline breaking at 423.
Target Prices (TP):
TP 1: 448 📈 (due to strong resistance)
TP 2: 468 🥇
Stop Loss (SL):
Place your stop loss at 377 to manage risk.
Technical Indicators:
The Relative Strength Index (RSI) shows bullish divergence, confirming the strength of this reversal.
Trade Summary:
Entry: At LH, neckline breaks at 423
TP 1: 448
TP 2: 468
SL: 377
Trade Type: Long Swing 🎢
Good Luck! 🍀
Stay informed and trade smart! 📊
SYS trade ideas

Systems upside potentialSYSTEMS should soon test the resistance of 420-424 level and once broken can go further up, Strong support at 390. It is in consolidation phase because broken 50ema but below 100 ema so need to break 100 ema and sustain above for further stride.

System Ltd (Bullish)Stock: Systems Ltd
Technical Analysis Context: The stock price is currently tapping into the FVG (Fair Value Gap) region, which spans from 398.70 to 389.57. This zone has historically acted as a significant pivot point for price movements.
Analysis and Thought Process:
FVG Region:
The FVG region represents a critical area where the stock price tends to react significantly.
Price is currently within this range, suggesting potential opportunities.
Resistance Levels:
We observe resistance levels at 411.63~412.97 and 415.
If the price bounces back and successfully crosses these resistance levels, it could signal a strong bullish move.
Higher Low (HL) Points:
The recent descending channel shows a pattern of lower highs and lower lows.
However, there are specific points where the price forms higher lows.
The price range of 455~460 corresponds to these HL points.
Trade Strategy:
Long Trade Entry:
If the price breaks above the resistance levels, consider entering a long trade.
This would be an opportunity to ride the potential bullish momentum.
Profit Targets:
Set profit targets in the range of 455~460.
These levels align with the HL points, indicating potential upward movement.
Stop Loss (SL):
Place a stop loss at 390.
This level corresponds to a point where maximum trade volumes were previously witnessed.
It acts as a safety net to limit potential losses.
Risk-Reward Ratio (RR):
The potential gain is approximately 11%~12%.
The risk-reward ratio is favorable at 2.2, indicating that potential rewards significantly outweigh the risks.
Summary:
Systems Ltd presents an interesting trading opportunity based on technical analysis. If the price breaks above the resistance levels and confirms bullish momentum, consider entering a long trade with profit targets around 455~460. Maintain a disciplined approach by setting a stop loss at 390 to manage risk effectively.
Remember that trading involves risks, and it’s essential to conduct further due diligence and consider other factors before executing any trades. Always follow your risk management rules and adjust your strategy as needed. 📈🔍🚀

SYS is BullishSYS finally seems to have given a breakout from the declining phase, bullish RSI divergence appeared and after that it printed a higher high breaking previous lower high. It would now define a higher low before starting a bullish rally. Targets are mentioned on the chart.

Bullish??Plan1
CMP or Buy1 around 407 - 408
Buy2 around 389 - 391
Sell around 418 - 421
Stoploss 388 (Closing Basis)
Plan2
Buy Above 423
Sell around 435 - 436
Stoploss 420 (Closing basis)
If these levels (Plan2) are Sustained,
Bullish Flag Pattern will be in play
with Target around 470 - 480

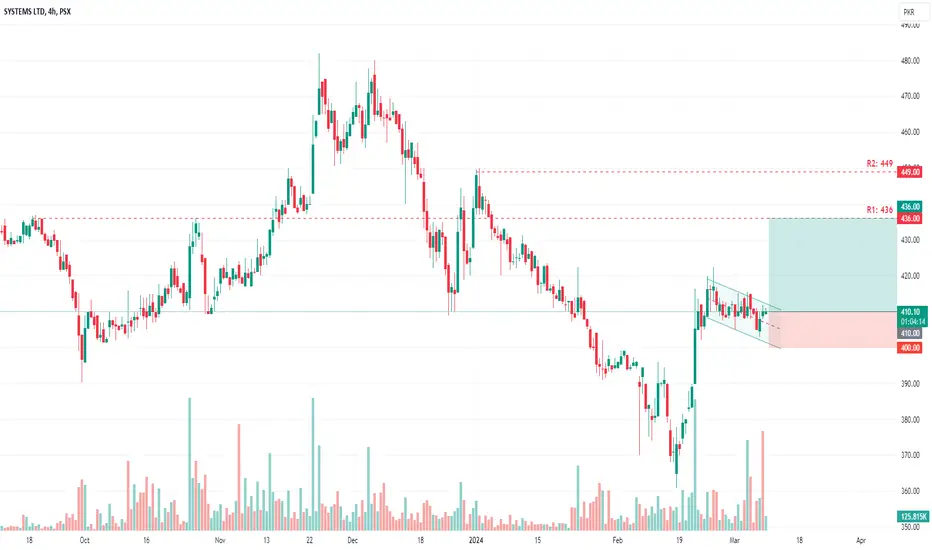
✳️ SYS | Flag Pattern Formation🚀 Stock Alert: SYS
📈 Investment View: Technically Bullish 📈
🔍 Quick Info:
📈 Entry Level: 410
🎯 First Targets : 436
🎯 Second Targets : 449
⚠ Stop Loss: 400
⏳ Nature of Trade: Short Term (Scalping)
📉 Risk Level: Medium
☪ Shariah Compliant: YES
💰 Dividend Paying: NO
📰 Technical View: The current price action is indicative of the formation of a flag pattern, suggesting a potential breakout towards the resistance level of 436. This level is deemed as the initial target. Further breakthrough and sustained movement may propel the price towards a second target approximately at 449. Conversely, in the event of a downside breakout, employing a stop-loss strategy at 400 is recommended to mitigate risk exposure.
Evening Star on Daily TF (Negative)Bearish Divergence on Monthly TF (Negative)
Bullish Engulfer Last Week's Candle (Positive)
Evening Star on Daily TF (Negative)

Bullish divergence on SYS daily chartBullish divergence wrt to RSI recorded on PSX:SYS daily and weekly charts.
Volumes seems to be increased as well.
Perfect opportunity for new entry.

SYSBuy1 at CMP or around 390 - 392 | Sell around 405 - 408
Buy2 around 380 - 382 | Sell around 390 - 392
Stoploss 370 (Closing basis)

SYS PSX Short Term and Long Term Trade SetupDouble Bottom
SYS PSX Short Term and Long Term Trade Setup
All targets wit Stop Losses Defined.
Follow Strict Stop Losses, if you want to ride it, make the stop loss at breakeven after reaching the first target.


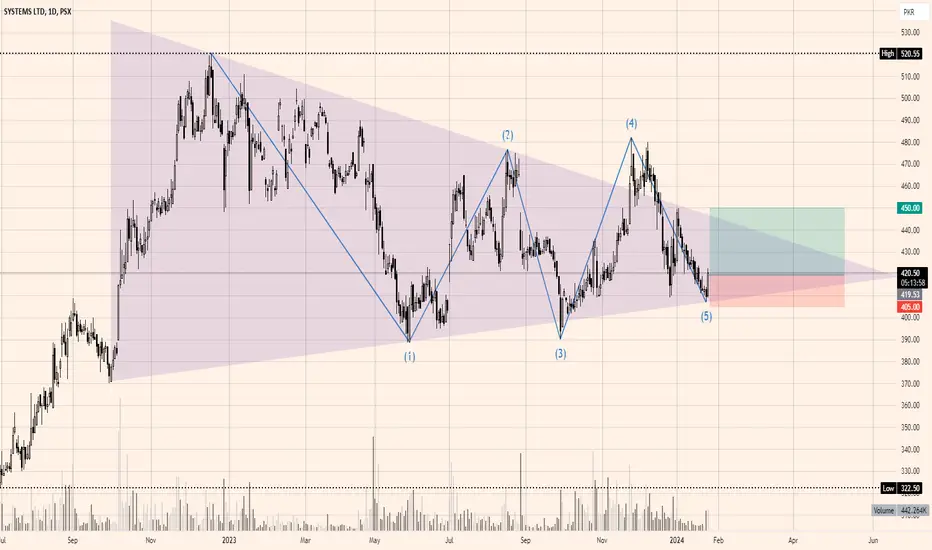
Will SYS breaks its triangleSYS is showing bullish divergence with RSI on daily time frame. Pull back is observed after testing ascending trend line of the triangular pattern. First resistance lies at the touch of upper triangle line around 438 and if it breaks and sustains then second resistance lies around 450. Risk is define below 405 break below of the structure.
SYS is BullishSYS is bullish on weekly time frame, and although it is currently experiencing selling pressure because of KSE-100 being bearish, a recovery would soon come. Targets are mentioned on the chart.
P.S Analysis is conducted on weekly time frame, so this might take months to play out

SYSCall was given on 27-11-2023
It hit my buying level and reversed.
a very good return in couple of days :-)

SYS is BullishSYS is currently in strong bullish momentum and the trend is expected to continue as price has tested the fib retracement level. Targets are mentioned on the chart.

SYS is BullishSYS is Bullish, it has revered the trend by printing first higher high and higher low, this could be beginning of a bullish rally.

ABCD Bullish Pattern As the chart is in bearish trend, short at point B below and the potential reversal zone might be at D

SYS : BAT Bearish Reversal PatternBAT Hormonic Reversal Pattern
Stop Loss : 479.71
Entry Price : LL once painted on chart
and will create same 1:1 and 1:2 ratio
now will wait for LL, LH below the PRZ point D.
will entry in to the trade

SYS:PSX is in process of making a Bearish AB=CD patternSYS:PSX on 1H timeframe is in process for making a potential AB=CD pattern. No divergence presently exists. Therefore Long Order 1 (Buy Stop) has been placed above point B with SL set below point C. TP1 and TP2 have been set for Long Order 1. PRZ has been projected at potential point D however confirmation and Short Entry shall only be made if Bearish Divergence forms at Point D.

Almost out of fuelP/E is high compared to rest of market , financial results will tell near future outlook, breakout and breakdown possible,in case of breakout i don't expect the same move as it has shown previously

System Limited (SYS) Technical Analysis |Pakistan Stock ExchangeIt is recommended to wait for a breakout before taking a long position, as the company has a strong fundamental background.

Upside breakout is imminent Bullish harmonic pattern formed. Potential Bullish breakout is on the cards. Wait for trend confirm before taking any positions.
