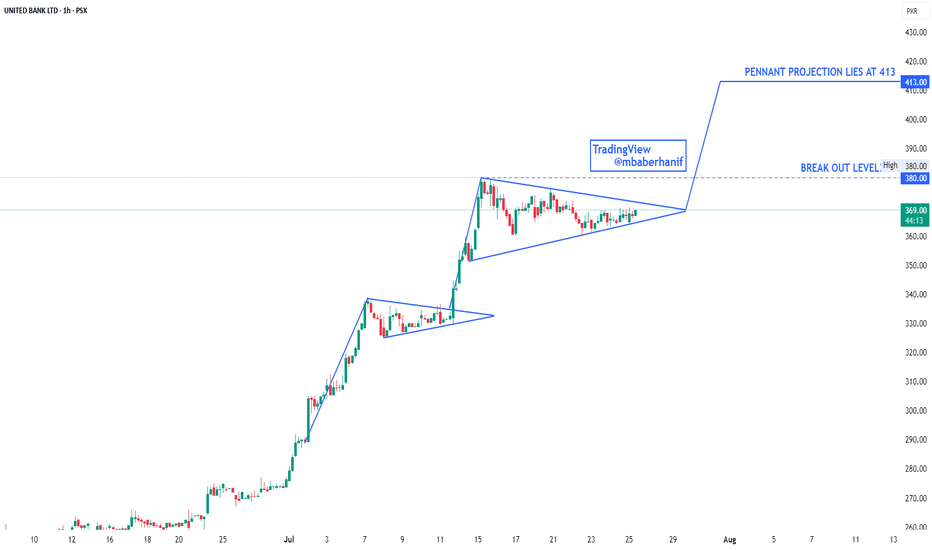
UBL : Forming Bullish PennantUBL on the 1-hour timeframe displays a strong bullish trend, marked by a series of pennant formations—each followed by sharp upward breakouts. Currently, the price is consolidating within a third pennant, indicating a potential continuation pattern. The breakout level is highlighted at 380, and if breached with volume confirmation, the price is projected to target the 413 level based on the pennant’s measured move. Overall, the structure suggests bullish momentum remains intact, and a breakout above 380 could trigger the next leg higher.
UBL trade ideas
UBL Share StrategyUBL Buying Strategy:
To determine if the proposed buying strategy for United Bank Limited (UBL) shares is viable, let's break down the plan:
- Buy Price: PKR 500-480
- Stop Loss: PKR 470
- Target Price: PKR 580
Analysis:
1. Risk Management: The stop loss is set at PKR 470, which is PKR 10-30 below the buy price range. This seems like a reasonable risk management strategy.
2. Potential Return: The target price of PKR 580 offers a potential upside of PKR 80-100, which translates to approximately 16-20% return.
3. Market Conditions: It's essential to consider current market conditions, trends, and any potential catalysts that may impact UBL's stock performance.
Recommendations:
1. Monitor Market Trends: Keep a close eye on market trends and adjust the strategy accordingly.
2. Set Realistic Targets: Ensure the target price is realistic based on UBL's financial performance and market outlook.
3. Diversification: Consider diversifying your portfolio to minimize risk.
UBL, Weekly Bullish Channel, Investor's Trade PlanPrice has touched weekly bullish channel
very prominent rejection candle seen
Similar pattern is also seen last year
correction expected
Accumulation opportunity for traders and investors
around 100 to 120 days cycle of accumulation box expected
major bullish activity expected around March
Buying recommended around 295-320 levels
UBL | Rejecting from supply zone!UBL tested its 283 level which was seen in October 2017 and currently rejection from its strong resistance level. Overall stock price is over bought and rejection can be expected or profit taking. Iff it breaks its previous high then only more upside can be expected. On the flip side, support level lies around 222.
UBL🚀 Stock Alert: UBL
📈 Investment View: Technically Bullish 📈
🔍 Quick Info:
📈 Entry Range: 184
🎯 First Targets : 190
🎯 Second Targets : 200
⚠ Stop Loss: 175
⏳ Nature of Trade: Short Term (Scalping)
📉 Risk Level: Medium
☪ Shariah Compliant: NO
💰 Dividend Paying: YES
📰 Technical View: Establishing bullish momentum, if it break and sustain resistance level of 190 then it can test 200. Stop loss can be placed below 175.
United Bank Limited (UBL) Chart AnalysisPattern Identification
The pattern visible on the UBL chart is a Falling Wedge pattern. Falling wedges are typically bullish reversal patterns that indicate a potential upward move after a downtrend.
Key Features
Falling Wedge:
The upper trendline is descending.
The lower trendline is also descending but converges with the upper trendline.
The pattern indicates decreasing selling pressure and potential accumulation.
Fibonacci Retracement Levels:
Fibonacci retracement levels are plotted to identify potential support and resistance levels.
Key levels are 23.6%, 38.2%, 50%, 61.8%, and 78.6% retracement levels.
Resistance and Support Levels:
Major resistance: Around PKR 283.51 (0% Fibonacci retracement).
Current resistance level: Around PKR 221.26 (23.6% retracement).
Key support levels: PKR 182.36 (50% retracement), PKR 158.25 (61.8% retracement), PKR 123.93 (78.6% retracement), and PKR 81.15 (1% Fibonacci retracement).
Current Price Action
The current price is PKR 220.44, indicating a breakout from the falling wedge pattern.
Future Forecasting
Bullish Scenario:
The breakout from the falling wedge suggests a bullish reversal.
If the price sustains above the breakout point and surpasses the immediate resistance level of PKR 221.26, the next target could be around PKR 236.31 (23.6% retracement) and then PKR 283.51.
A strong bullish move could push the price towards the previous highs around PKR 283.51.
Bearish Scenario:
If the price fails to hold above the breakout level and falls back into the wedge, it could retest the lower trendline of the wedge.
A breakdown below the lower trendline would invalidate the bullish scenario and could lead to further declines towards support levels around PKR 182.36, PKR 158.25, and PKR 123.93.
Conclusion
Falling Wedge Pattern: The chart correctly identifies a falling wedge pattern, which is typically a bullish reversal pattern.
Bullish Breakout: The price has broken out of the wedge, indicating potential bullish momentum.
Key Levels: Immediate resistance at PKR 221.26, with potential targets at PKR 236.31 and PKR 283.51.
Monitoring: It's crucial to monitor the price action and volume to confirm the breakout and watch for any signs of a reversal back into the wedge.


