UNITY trade ideas
Bullish Divergence
Closed at 26.89 (05-06-2025)
27.50 - 28 is an Immediate Important
Resistance that needs to cross & sustain
for further upside.
There is a Bullish Divergence which may
help this time to break the resistance.
But better approach would be to wait
for the Resistance to cross & then take entry.
If it does, 32 - 33 is easily reachable.
On the flip side, it should not break 23.50
otherwise there would be more selling pressure.
Inverse Head & Shoulders Forming – Watch for Breakout Above 28UNITY indicates the formation of an inverse head and shoulders pattern, a bullish reversal setup. The neckline resistance is drawn around the PKR 27.5–28 level, which also aligns closely with the 200-day EMA at PKR 28.23, adding to its significance. Volume has notably increased during the formation of the right shoulder, suggesting growing bullish interest. A long position should only be considered after a decisive breakout above the neckline resistance , ideally on strong volume, confirming the pattern. If the breakout occurs, the projected upside target could extend toward the PKR 34–35 range, which is a previous major resistance zone. Until then, the setup remains neutral and unconfirmed.
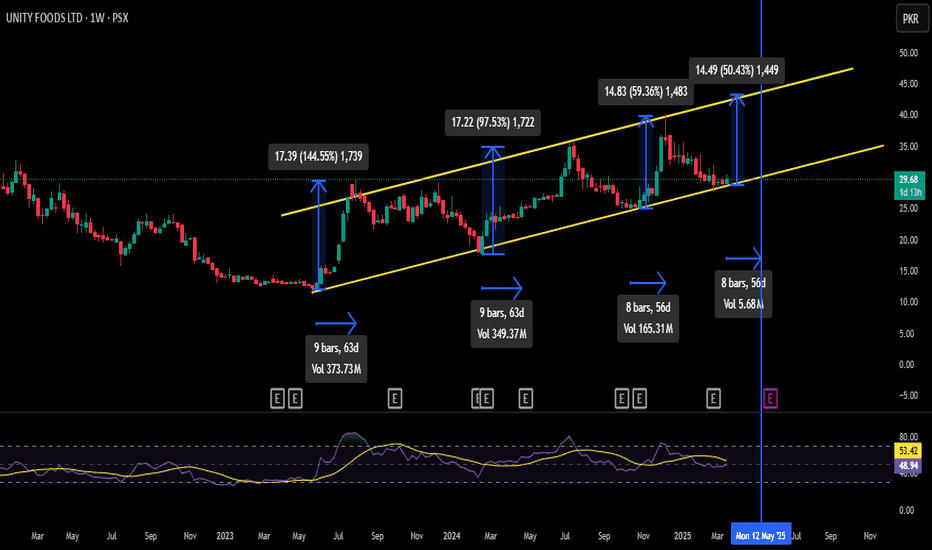
UNITY- INVESTMENT TRADEUNITY in trading in uptrend channel since May 23
It has reached bottom of this channel
It has successfully created a perfect spring/bear trap in Prominent OverSold Area (POSA)
It is low risk high probability investment trade set up with around 50% potential gain.
BUY1 @27.8
BUY2 @26.1
TP 35.8
SL 23.9
UNITY | Parallel Channel On Weekly Time FrameThe price is moving in a parallel on the daily timeframe, indicating a potential massive bullish rally. Showed a pull back from 200-day EMA and currently 4% up. We anticipate a 45% bullish wave in the coming days.
Trading Strategy
- Entry: Consider long positions at 27.50
- Stop-loss: Set at 23.93, just below the support level
- Risk-reward ratio: 1:3.5
- Swing Trade Target Level: 40
Trading Reminder
- Assess your risk and calculate potential losses before entering any trade.
- Trade wisely and only enter positions that align with your strategy and risk tolerance.
- Stay calm and avoid impulsive decisions driven by FOMO. Trading is a long-term journey.
Beautifully making HH HL.Beautifully making HH HL.
Immediate Support is around 29 - 29.30
Monthly Closing above 29.13 would be a
healthy sign.
If 29 is Not Sustained, Next Support would be
around 24.30 - 26.30
& if 29 is Sustained,34 - 35 can be witnessed.
Immediate small Resistance is around 31.55
Should Not Break 24 even in Worst Case.
UNITY is BullishThe macro trend of price action is bullish fueled by a humongous insider transaction. Bears assumed control of the price action for few months which resulted in a good retracement. However, now the descending trendline is broken and a double bottom reversal pattern has also formed that led to the break of previous lower high, indicating that bulls have assumed control of the price action now. First higher high is printed successfully and with bulls in the driving seat further highs are expected as per Dow theory. Moreover, the macro projections of AB = CD pattern also have targets of 40+.
UNITYThe stock appears to be consolidating in a sideways trend. Long position can be consider around 28.70, while resistance lies at 30.80 and 32.40. A breakout above 32.00 could signal an upward trend. Consider range trading or pullback buying strategies. Always conduct thorough research and consult with a financial advisor before making investment decisions.
UNITY FOODS BUY iDEA at PSXThe Unity Foods seems to be in good buying range as the Bullish Divergence was observed and the price has broken the Lower High and forming new Higher Highs. The price is testing the Fib Level of 0.28.
Hence it is suggested to enter the market for the UNITY for a possible 20% gains.
what are your views about it ?


