PUMP/USDTCurrent Market Structure
Strong pump occurred around July 13th, peaking above 0.0072.
Price retraced and is now ranging between 0.00580 – 0.00640.
Appears to be forming a consolidation or flag pattern, which can break either way.
Volume is declining, indicating potential for breakout buildup.
PUMPUSDT trade ideas

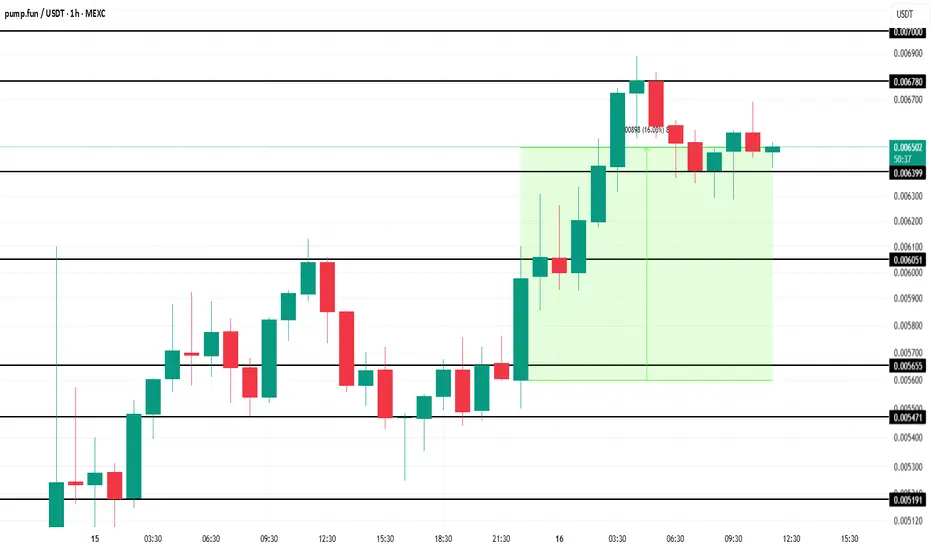
Pump.Fun (PUMP) Token Nears Milestone $1 Billion OI In 3 DaysMEXC:PUMPUSDT price stands at $0.0065 after bouncing off the $0.0063 support level. The token has gained 16% in the last 12 hours , showing that the demand for PUMP is strong.
The valuation of Pump.Fun has skyrocketed in just two days, reflecting a surge in demand. In only 48 hours since its launch, the altcoin has amassed 45,500 holders .
The macro momentum behind Pump.Fun is undeniable, with open interest in MEXC:PUMPUSDT nearing $913 million. It is on track to hit the $1 billion mark by day three of its launch.
Given the ongoing momentum and investor confidence, the token is likely to continue pushing upwards in the near future.
With the current market conditions and growing support, MEXC:PUMPUSDT could breach the $0.0067 resistance and reach as high as $0.0070 in the coming days. This would mark a significant achievement for the altcoin, continuing its impressive upward trajectory.
However, if MEXC:PUMPUSDT faces a sudden wave of selling or broader market bearishness, the token could lose the $0.0063 support level. A decline below this point would likely see PUMP slipping to $0.0060, invalidating the bullish outlook and signaling a potential market correction.

#PUMP is trying to break out of the falling channel! #PUMP Our previous trade setup, SL, got hit.
Currently, it is trying to break out of the falling channel on the 1H chart.
If it holds above the breakout zone, it could push toward $0.0082 📈
Entry: 0.0060 – 0.0063
Stop Loss: 0.00578
Targets:
TP1: 0.0068
TP2: 0.0074
TP3: 0.00795
TP4: 0.00823
Classic breakout setup, strong R: R potential ahead
DYOR | NFA

Dirty Little Crypto World: Episode 1 🚩🔍 Dirty Little Crypto World: Episode 1 – Built for Beginners, Designed to Drain 🧠💥
I've called some BIG red-flagged ones before:
FTX: ( i will post proof in the comments)
Luna:
— both collapsed, and I said it before the smoke hit the screen.
But this time, the 'smoke' moved differently:
The market was pumping — and then came the thick, dark distraction of Pump.fun .☁️🧨
That’s why I posted my trades:
Long on real assets like ETH, DOGE, OP, SEI, SUI, HBAR etc etc —
Short on the smoke screen — the Pump.NoFun thing.
(trades i posted are small positions, trading leverage leads to losing money. do not trade unless you are experienced) ⚠️
Because while legitimate projects were finally gaining momentum , this launch was perfectly timed to suck attention and liquidity away from real value .🧬💸
🧪😤Recently I launched a token.
🧘♂️📊For years, I’ve traded thousands.
Now I understand the mechanics from the inside — and what I see isn’t innovation.
It’s exploitation. 🚫
This is Episode 1 of Dirty Little Crypto World — a 10-part series where we ask:
“Are we building the future — or destroying it?” 🔥💣
🧼 The PUMP.FUN Problem
At first glance, it looks fun. Quick. Easy. 🎉📲👻
But look closer:
🚩 PEG 18-rated app🧒🔞
🚩 “Launch a coin in 1 click”🤡
🚩 114 markets overnight on top CEXs (wow!! congrats, exchanges. Safu, Bravo🏦)
🚩 Buggy, unresponsive trading UI (it’s called SLIPPAGE/bad market execution to say it right , kiddos!)🐢💀
🚩 No team transparency — just meme avatars & chaos energy. 🎭
🚩 Built on Solana with zero accountability, no docs, no disclosures🧾❌
The Worst Part?
This system is built for children .🧒🕹️🤢🤢🤢
For beginners.
For untrained, unprotected traders who get chewed up by slippage, stealth taxes, and emotional manipulation. These kids ain't gonna be scientists, these kids will end up being scammers😞- or in the best case scenario they will be spending a lot of time in McDonalds🍟🧢.
It’s not just technical abuse.
It’s psychological warfare. 🎯🧠
SAD!!
This isn’t decentralization .
This isn’t crypto’s promise .
This isn’t adoption , nor 'memefication' .
This is the casinoization of the blockchain 🎰🔥🧨 — and we’re letting it shape our future?
The Big Question:
Are we going to use crypto to uplift humanity?🌍🚀
Or…
Are we going to let it become a weapon of distraction , addiction, and destruction —
especially for the next generation? 🎮📉🧒
Because right now, the answer’s looking ugly . (😖BFU!)
🔥 This Series Exists for One Reason:
We deserve better crypto. 💙🔧
Not because we’re bitter.
Because we’ve seen what it could be.
Because we’ve already paid the price.
Because the GOOD SIDE of crypto MUST prevail.🛡️🧬
💬 Harsh? Maybe.
But wait for Episodes 2, 3, 4…
Because I’ve got 10 truths lined up that need to be heard. Loudly. 📢📊
I’m not here to tear things down —
I’m here to ask you to join me and clean things up .🧽🧼
Unfortunately we need to deal with some serious s**t my friends, but we can make it!
One Love,
The FXPROFESSOR 💙
Disclosure: I am happy to be part of the Good side of Crypto where humanity goes forward and not downwards. Let's Fight for it.

Where Should We Rebuy The PUMP? (8H)With the large bearish master candle formed at the top, the structure has turned bearish.
The green zone is the best and lowest-risk area for long positions or rebuys.
Reaching this zone may take some time, but you can already add this symbol to your watchlist and wait for it to reach the area before entering a position.
A 25%–45% return can be expected from this zone.
A daily candle closing below the invalidation level will invalidate this analysis.
For risk management, please don't forget stop loss and capital management
Comment if you have any questions
Thank You

$PUMP’s Support Holds at $0.15 – Reversal Signal?Analysis: NYSE:PUMP at $0.167 is holding above the $0.15 support, with a bullish hammer on the 4-hour chart. Resistance at $0.17 remains a hurdle. RSI is neutral at 55. Recommendation: Buy dips to $0.15; target $0.18, stop below $0.145.

$PUMP’s Fibonacci Retracement Targets $0.20Analysis: NYSE:PUMP at $0.167 is approaching the 61.8% Fibonacci level ($0.17) from its recent low of $0.09. A break could target the 100% level at $0.20. Support at $0.14 is key. Recommendation: Buy above $0.17; sell partials at $0.20.

$PUMP’s Stochastic at 60 – Room for Growth?Analysis: At $0.167, NYSE:PUMP ’s Stochastic Oscillator is at 60 on the daily chart, suggesting room for upside before overbought levels. Resistance at $0.17 is critical; support at $0.15 holds. Recommendation: Long on a break above $0.17; stop below $0.15.

$PUMP’s Volume Spikes at $0.167 – Breakout Imminent?Analysis: NYSE:PUMP ’s 24-hour volume has spiked, supporting its price at $0.167. The price is above the 50-day MA ($0.14), with $0.17 as resistance. A breakout needs sustained volume. Recommendation: Buy above $0.17; watch for volume contraction.

$PUMP Faces $0.17 Resistance – Rejection Risk HighAnalysis: NYSE:PUMP at $0.167 is struggling to break $0.17 resistance, with declining volume on the 1-hour chart. The 50-period EMA at $0.155 is support. A rejection could test $0.15. Recommendation: Short below $0.165; target $0.15, stop at $0.172.

$PUMP’s MACD Bullish at $0.167 – Upside to $0.20?Analysis: The MACD on the 4-hour chart shows bullish momentum for NYSE:PUMP at $0.167, with the histogram expanding. Resistance at $0.17 is key; a break could target $0.20. Volume needs to confirm. Recommendation: Long above $0.17; stop below $0.16.

$PUMP Consolidates at $0.167 – Key Support at $0.15Analysis: NYSE:PUMP is consolidating between $0.16 and $0.17 after a 153% rally (per X posts). The 20-day moving average at $0.15 is critical support. Bollinger Bands are tightening, signaling a big move soon. Recommendation: Buy dips near $0.15; sell if it breaks below.

$PUMP Nears Overbought RSI at $0.167 – Pullback Looming?Analysis: NYSE:PUMP ’s RSI on the 1-hour chart is at 69, nearing overbought territory at $0.167. The price is testing resistance at $0.17, with low volume on recent pushes. A rejection could see a dip to $0.15 support. Watch for RSI divergence. Recommendation: Short on a failed breakout above $0.17; stop above $0.175.

$PUMP’s Ascending Triangle Signals Potential 20% Rally – Risks tAnalysis: At $0.167, NYSE:PUMP is trading within an ascending triangle on the daily chart, characterized by higher lows converging toward a resistance at $0.17. This pattern suggests accumulation, with bulls defending the $0.15 support zone (aligned with the 50-day moving average). The 200-day moving average at $0.13 provides additional support, reinforcing the bullish structure. The Stochastic Oscillator is at 60, indicating room for upward movement before overbought conditions. However, the token’s volatility, driven by Pump.fun’s meme coin ecosystem, warrants caution—24-hour trading volume has surged recently, but meme coins are prone to sharp corrections. A breakout above $0.17 could drive NYSE:PUMP to $0.20–$0.22, a 20–30% move, but a drop below $0.15 risks invalidating the pattern, targeting $0.13. On-chain activity on Solana and Pump.fun’s platform adoption are key drivers to monitor. Use tight risk management given the speculative nature of $PUMP.
Key Levels:
Resistance: $0.17, $0.20, $0.22
Support: $0.15, $0.13
Recommendation: Enter longs on a breakout above $0.17 with confirmation; scale out near $0.20 to lock in profits.

$PUMP at $0.167 Tests Key Resistance – Breakout or Rejection?Analysis: NYSE:PUMP is currently trading at $0.167, approaching a significant resistance zone around $0.17, which has acted as a ceiling in recent trading sessions. On the 4-hour chart, the price is forming higher highs and lows, indicating a bullish trend since breaking above the $0.13 support in early April (as suggested by X posts). The Relative Strength Index (RSI) is at 68, close to overbought levels, signaling caution for short-term longs. However, the Moving Average Convergence Divergence (MACD) shows a bullish crossover, with the MACD line above the signal line, supporting potential upside. Volume analysis indicates a 24-hour spike, aligning with increased market activity on Solana-based tokens. A breakout above $0.17 could target $0.20, the next psychological level, but failure to hold $0.16 may lead to a pullback toward the 50-day moving average at $0.14. Traders should monitor Solana’s ecosystem sentiment and set stop-losses below $0.15 to mitigate downside risk.
Key Levels:
Resistance: $0.17, $0.20
Support: $0.15, $0.14
Recommendation: Watch for a close above $0.17 with strong volume for long entries; avoid chasing if RSI exceeds 70.

PUMPBTC SELL SETUP, Sold at $0.14400PUMP PERPETUAL TRADE
PUMPBTC SELL SETUP
Currently $0.14400
Sold at $0.14400
(Trading plan If PUMPBTC/USDT up to $0.17 we will add more shorts)
Expecting target $0.13100 OR DOWN
Incase of early exist will update this anaylsis
Its not a Financial advice

Closed over 200MA. 4HR..works every time!This is a sleeper and 500% in less than 12 hrs
200 MA crosses above on 4 hr toime frame
Increasing volume
