Pyth long to 0.1950Went long on pyth just now. Targeting $0.1950...thats final target incase we get big pump.
I'll be scaling out from $0.1737 and monitor along the way.
PYTHUSDT trade ideas

Pyth long to $0.1735Recently opened a long position on pyth. Aiming for $0.1666 for tp 1 and full close at $0.1735

PYTH is bullishBINANCE:PYTHUSDT
PYTH bounced from very strong support
Entry 0.40
Target 0.60
Stop 0.25

Pyth doesn't have to be Daily 5 SMA's Crypto Revolution Indicator
Crossing up Enter now is ok.
RSA 13 is upward
Stock RSI crossing up at 38.52-28.02
Bullish
108% Upside.
Oh man, is this the time I have been waiting for? When all thinks just to fall in place, where all the losses can now be re coupled once more. I need to stick to the plan. The plan is the plan. Measure the success and improve then change it if it really is the right time.

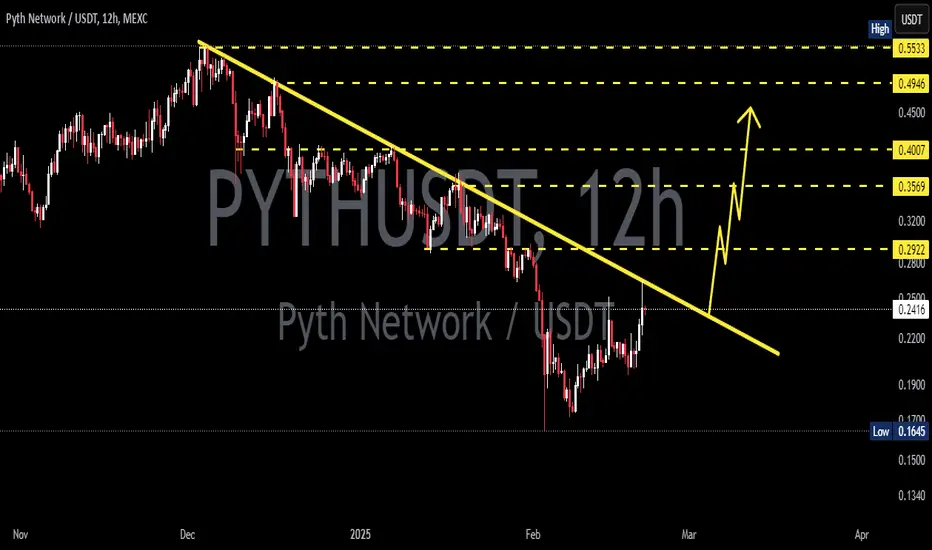
PYTHUSDT 12HPYTH ~ 12H Analysis
#PYTH Pay attention to this coin. Buy after successfully penetrating this resistant line with a short -term target of at least 10%+.
PYTHUSDT(PYTHNETWORK) Updated till 20-02-25PYTHUSDT(PYTHNETWORK) Daily timeframe range. looks like it found a support at 0.1732. it will be optimal if it stays above it below that is a void. recent resistance at 0.2673. if money flows into it, it could cover some range here.

PYTH CHART ANALYSİS - EDUCATİONAL POSTBest Books on Algorithmic Trading
By now we all know how effective and profitable algorithmic trading can be for traders and investors. In stock markets across the world, algorithmic trading alone accounts for approximately 70-80% of trading volume. You read that correctly.
Yet the vast majority of people trading crypto are doing it manually, resulting in missed or poorly timed trades. Even worse, manually trading is based on feeling and gut instinct rather than data and analysis, resulting in costly mistakes and missed opportunities.
However, despite its many benefits, algorithmic trading might seem a bit complex at first. Thankfully, there’s no shortage of excellent books to get you started if you’re a beginner interested in learning about automated trading strategies. And for the more advanced algo traders among us, there is always something new to learn.
With this in mind, we’ve put together a handy list of the best books on algorithmic trading, covering users of all experience levels, whether you’re a beginner in need of a basic introduction or a seasoned veteran looking to add a few additional advanced tools and techniques to your trading arsenal.

Pyth longEntered a long on #pyth just now. Won't be able to monitor, going to bed.
Expecting a breakout
Target: $0.2330

PYTH DAILY TIMEFRAME UPDATE (ON DEMAND) ❤️ THIS POST AND I WILL SHARE NEXT Pair
#PYTH DAILY TIMEFRAME UPDATE (ON DEMAND)
The Pyth Network is the largest and fastest-growing first-party oracle network. Pyth delivers real-time market data to financial dApps across 40+ blockchains and provides 380+ low-latency price feeds across cryptocurrencies, equities, ETFs, FX pairs, and commodities.
ANY THOUGHTS ON EURONEXT:PYTH ?

PYTHUSDT: A Massive Move Incoming? Watch This Level Closely! Yello, Paradisers! Is PYTHUSDT about to break out, or is a deeper drop still on the table? Let’s break it down.
💎PYTHUSDT has formed a well-structured descending channel with a corrective wave pattern and bullish divergence, signaling a strong probability of an upcoming bullish move. However, confirmation is key.
💎If PYTHUSDT breaks out and closes candle above the resistance zone, this will validate the descending channel and could trigger a bullish move.
💎In case of panic selling or a deeper retracement, we may see a temporary bounce, but the real focus should be on the resistance zone and a confirmed breakout for a high-probability setup.
💎On the flip side, if PYTHUSDT breaks down and closes candle below the key support level, the bullish setup will be invalidated, and waiting for better price action would be the smarter approach.
🎖 The key here is patience and precision—don’t jump in blindly. Watch for confirmation, trade with discipline, and always wait for the best setups. The market rewards those who stay ahead of the herd!
MyCryptoParadise
iFeel the success🌴

PYTH/USDT | 1W🩸 SEED_DONKEYDAN_MARKET_CAP:PYTH ⁀➷
#PythNetwork. Macro chart Another
💯 Intermediate Target - $1.23
🚩 Macro Target 1 - $1.90
🚩 Macro Target 2 - $3.40
🚩 Macro Target 3 - $5.60
- Not financial advice, trade with caution.
#Crypto #PythNetwork #PYTH #Investment
✅ Stay updated on market news and developments that may influence the price of Pyth Network . Positive or negative news can significantly impact the cryptocurrency's value.
✅ Exercise patience and discipline when executing your trading plan. Avoid making impulsive decisions driven by emotions, and adhere to your strategy even during periods of market volatility.
✅ Remember that trading always involves risk, and there are no guarantees of profit. Conduct thorough research, analyze market conditions, and be prepared for various scenarios. Trade only with funds you can afford to lose and avoid excessive risk-taking.

Is PYTHUSDT About to Explode or Break Down?Yello, Paradisers! PYTHUSDT is shaping up nicely after forming a W pattern at a key supportive trendline. But the real question is—will the price hold and push upward, or is a breakdown lurking just around the corner? Let’s break down the critical levels and scenarios you need to watch closely.
💎If PYTHUSDT breaks above the resistance level and closes a candle above it, the odds of a bullish move increase significantly. This breakout would confirm the W pattern, signaling potential upside momentum.
💎There's still a risk that PYTHUSDT could retrace further before any bullish breakout happens. If the price drops lower, it could be a liquidity grab (inducement) to shake out weaker hands before bouncing from the strong support zone.
💎In that case, it’s better to wait for the retracement to play out and then look for a bullish reaction from the strong support zone before taking any action.
💎Now, here’s the worst-case scenario: if PYTHUSDT breaks below the strong support zone and closes a candle beneath it, the bullish structure will be completely invalidated.
💎In this case, it’s better to stay patient and wait for a clearer price structure to form before re-entering any positions. Never chase the trade—we wait for the highest probability setups to align.
🎖 Remember, patience is key in trading! The market will always provide opportunities, but it’s the disciplined traders who capitalize on them. Stay focused on key levels, wait for confirmations, and don’t get caught by false moves.
MyCryptoParadise
iFeel the success🌴


#PYTH/USDT breaks the Diagonal Trendline on the 4-Hour TF!#PYTH/USDT breaks the Diagonal Trendline on the 4-Hour TF!
💡 Plan: Testing the trendline and looking good for a potential long.
🔑 Key Levels:
Resistance: PMH $0.5539
Support: PML $0.3231

PYTH/USDT: Trendline Break with Triple Wave TargetHere's a concise analysis of the PYTH/USDT 4H chart:
Technical Setup:
- Breaking out of descending trendline (yellow)
- Current price: 0.3697 USDT (+9.06%)
- Forming ascending channel (gray lines)
- Key resistance zone: 0.48-0.52 (purple box)
Projected Targets:
1. 0.40
2. 0.45
3. 0.51
Key Levels:
- Support: 0.33 (marked as stop loss)
- Current resistance: 0.37
- Volume confirming breakout (15.77M)
Strategy:
Long above 0.35 with stop loss at 0.32
First target at previous resistance 0.40
Chart shows strong reversal potential with clear target zones marked by the ascending channel and resistance box.
Risk Management Note:
Always use proper position sizing and consider the volatile nature of this asset
* DO YOUR OWN RESEACH * DYOR

Pyth network ideaPyth network has finished wave 1 at fibo distance 2.618 and if measure extension will get extension at distance 200% and 261.80% if bitcoin continues to go down, if the down can end at that 2 distance if you think the up market will come back. It might be like this.

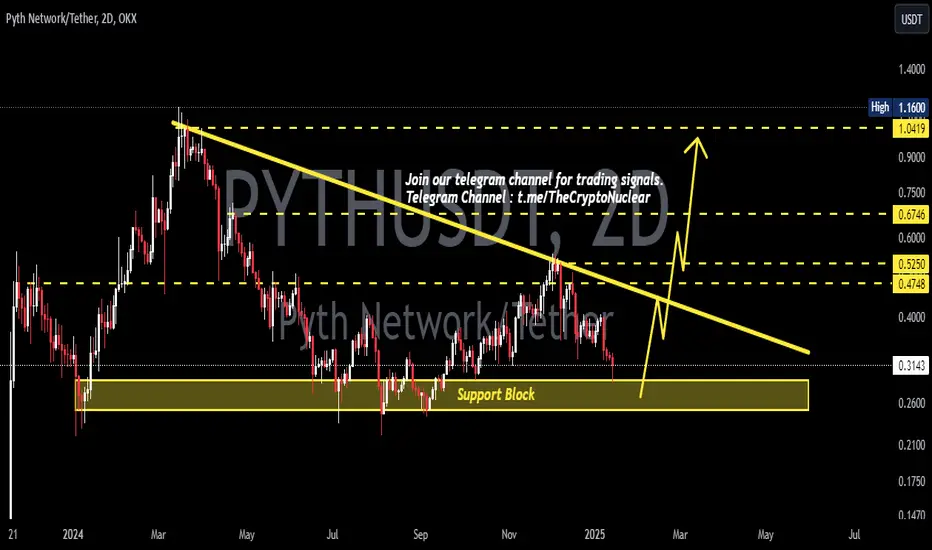
PYTHUSDT 2DPYTH ~ 2D
#PYTH So far this support block continues to keep the price from dropping any lower. If you still have Conviction on this coin, buy it gradually with a target of 20%++
#PYTH (SPOT) entry range (0.3660- 0.4660)T.(0.9500) SL( 0.3573)BINANCE:PYTHUSDT ( Infrastructure )
Entry (0.366- 0.466)
SL 4H close below 0.3573
T1 .50
T2 .66
T3 .74
T4 .95
______________________________________________________________
Golden Advices.
********************
* collect the coin slowly in the entry range.
* Please calculate your losses before the entry.
* Do not enter any trade you find it not suitable for you.
* No FOMO - No Rush , it is a long journey.
Useful Tags.
****************
My total posts
www.tradingview.com
1Million Journey
www.tradingview.com
www.tradingview.com
**********************************************************************************************
#Manta #OMNI #DYM #AI #IO #XAI #ACE #NFP #RAD #WLD #ORDI #BLUR #SUI #VOXEL #AEVO #VITE #APE #RDNT #FLUX #NMR #VANRY #TRB #HBAR #DGB #XEC #ERN #ALT #IO #ACA #HIVE #ASTR #ARDR #PIXEL #LTO #AERGO #SCRT #ATA #HOOK #FLOW #KSM #HFT #MINA #DATA #SC #JOE #RDNT #IQ #CFX #BICO #CTSI #KMD #FXS #DEGO #FORTH #AST #PORTAL #CYBER #RIF #ENJ #ZIL #APT #GALA #STEEM #ONE #LINK #NTRN #COTI #RENDER #ICX #IMX #ALICE #PYR #PORTAL #GRT #GMT #IDEX #NEAR #ICP #ETH #QTUM #VET #QNT #API3 #BURGER #MOVR #SKL #BAND #ETHFI #SAND #IOTX #T #GTC #PDA #GMX #REZ #DUSK #BNX #PYTH

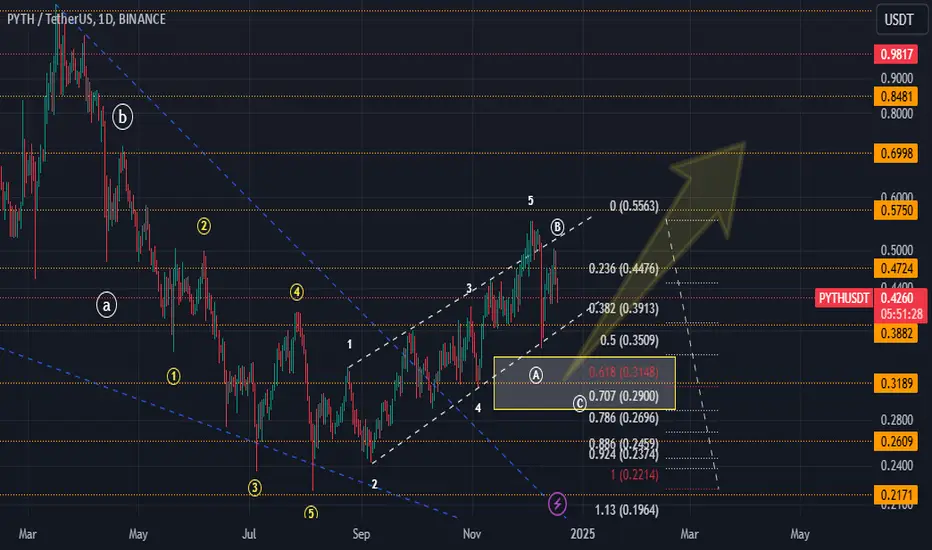
Wave CWave C is expanding from wave 2.
I am waiting for rotation from the yellow box. Provided rotation from the yellow box is available 0.70.
PYTHUSDT - Rounding bottom patternBINANCE:PYTHUSDT stands out as a strong investment opportunity, often considered an improved version of $LINK.
While sharing similarities with LINK, it surpasses it in certain key areas. Being a new project with low market saturation, it offers significant potential for growth ✅️
The med-term targets are outlined in the chart.
Accumulation is recommended now up to 0.236 fibo level .
Best regards Ceciliones🎯

PYTH / USDT : Eyeing a Breakout at Trendline resistance PYTH/USDT: Eyeing a Breakout at Trendline Resistance
PYTH/USDT is gearing up for a significant move 📈 as it nears a critical trendline resistance zone 📊. The pair is moving with momentum, and this time, a breakout looks highly promising 💥. If confirmed, this could pave the way for a strong bullish trend 🚀. Keep it on your radar 👀 and watch for key confirmations before entering.
Key Insights:
1. Trendline Resistance: PYTH/USDT is approaching a key trendline that has been a consistent hurdle. A breakout above this level could trigger substantial upside movement.
2. Volume Watch: A surge in trading volume during the breakout will confirm buyer strength 🔥.
3. Bullish Momentum: Indicators like RSI and MACD are leaning bullish ⚡, hinting at an impending breakout.
Steps to Confirm the Breakout:
Look for a decisive 4H or daily candle close above the trendline 📍.
Check for a volume spike during the breakout to confirm strong buying pressure 📊.
A successful retest of the broken resistance as new support will validate the move ✅.
Stay vigilant for fakeouts, such as sharp pullbacks or wicks above the trendline ⚠️.
Risk Management:
Utilize stop-loss orders to safeguard your position 🔒.
Align position sizes with your overall trading plan 🎯.
This analysis is for educational purposes and not financial advice. Always DYOR before making investment decisions.

PYTHUSDT is BullishPrice has given a good breakout from the accumulation phase and has printed a higher high, signaling the control of bulls. If bulls maintain their grip on price action and manage to break freshly printed higher high then we can expect new highs as per Dow theory. Targets are mentioned on the chart.

PYTHUSDTWe can attempt to buy PYTHUSDT from specified level as it make HL , also 0.618 FIB level intact indicate that it moves upward.
SL , TP mention in chart.
