QNTUSDT trade ideas

QNT - inverted head and shoulders patternAs you can see there is inverted head and shoulders pattern, which is bullish... QNT can bring us a great and nice gains here... i am expecting small dip to 120-116 area before going higher. BTC must stay stable...
MANAGE YOUR RISK
NOT A FINANCIAL ADVICE

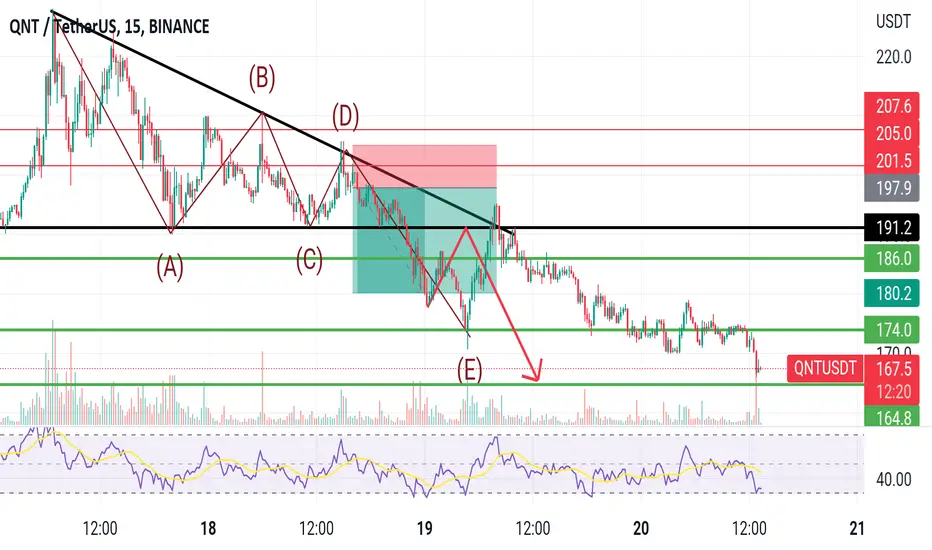
bullish and bearish short term scenarioTwo scenarios, red arrow outlines the bear outcome, green arrow for the bullish outcome. In the current graph forms, the bullish outcome has 80% chance of happening in my opinion. trade with caution it is very volatile

$QNTIn my opinion, there is going to be a correction before $QNT flies. If you want to accumulate here are the right levels to be buying

QNT/USDTQNT/USDT
Well, we see that the $155 resistance has been broken.
The inverted head and shoulders are clearly visible.
The targets are indicated in the picture.
#QNTUSDT #QNT #BTCUSDT #BTC #ETHUSDT #DOGE #DOGEUSDT

QNTUSDT | BUY ON BREAKOUTQNTUSDT has been trading with in a triangle. The price has been converged and broken above the triangle.
The 100MA also act as support.
We are watching out the retest of breakout zone for trade position.
The bulls are in complete control.
Trade your levels accordingly.

BUY QNT AT $110-120 areaQNT FOMO will soon be over. Short term pullback is expected.
Patience is a virtual. Wait and get QNT cheap around $110- $120

QntQnt is so bullish
so grab some and wait for the bullrun to start
Btc is going to do well for the short term before it becomes bearish again
And may we talk here about anew low like 16-14K
Stay tuned!!

qntusdt daily analysishi dear trader this analysis by volum andicator for detect sel zon and buy zon and detect tp and sl

short term scenarioQNT/USDT
short setup targets in the green zone
stop loss aboce 183 h4 close we might see a pump to 180 before we dump to our targets my target will be at 173 max

QNT/USD is not Bearish nor Bullish.QNT/USD is not Bearish nor Bullish.
It is in advancing phase as Trend not seem's to break Bullish trend because the graph didn't hit LL after an recent HH.
As this is the position for short because it is in downward trend.
Happy Trading!

From $200 to $164, as I predicted🥶🥶This is the first analysis where I said to enter at 198 and exit at 180. Here is that one
In my second analysis, I showed 2 possible scenario. One of them was "Retest of $190, then $164. Here is the chart of that
I will publish about the next move later.
Follow Me for getting Further Update😝

QNT :: Long Short Term :: Nasty CorrectionShort Term :: Price may be attracted to energy center.
Long Term :: Expect a nasty correction if energy center reached.

#QNT/USDT 1DAY UPDATE !!
Hello dear traders, we here new so we ask you to support our ideas with your LIKE and COMMENT, also be free to ask any question in the comments, and we will try to answer for all, thank you, guys.
QNT UPDATE:- Quant (QNT) rose higher on Friday, as prices rebounded following three days of straight declines.
Earlier in today’s session, QNT/USD rose to an intraday peak of $179.15, less than a day after falling to a low of $159.06.
The move saw the token rise from yesterday’s one-week low, which came just days after trading close to a one-year high.
Looking at the chart, today’s rebound in quant saw the 14-day relative strength index (RSI) also move away from a support point of its own.
As of writing, the index is tracking at 59.01, near its lowest point since September 23.
The next visible resistance seems to be at 65.00, and should price strength reach this point, we could see QNT trading above $200.00.
Sorry for my English it is not my native language.
Hit the like button if you like it and share your charts in the comments section.
Thank you

🔥 QNT Further Consolidation ExpectedA couple of days ago I made an analysis on QNT where I expected the price to drop towards the $160 area. After reaching said area, we got an expected bounce.
In my view, QNT will move up another 10-20% from here, after it will reverse again. With BTC trading unstable, the most likely scenario would be a phase of consolidation, followed by a drop.
As mentioned in my previous post, I think that QNT has most likely topped. The massive volume spike from a couple of days ago is a key reversal indicator for me.
Where QNT will top is still unsure. The yellow dotted line is just an indication of a possible resistance. Time will tell where QNT will reverse exactly.

QNTUSDT | BEARISH PARALLEL CHANNELQNTUSDT has been trading in bearish parallel channel.
The price is printing lower lows and lower highs.
Currently the price is trading at higher boundary of channel.
The bears are in complete control
Manage your trades accordingly.

QNT//USDT Simple rules of risk management and trading strategiesCoin in the Coinmarket: Quant
This coin is for work as an example no more, now there are many similar ones with similar trading situations.
On the chart showed the trend, the figures that are formed, the support / resistance levels.
The figures show the potential entry points in case of a breakthrough or holding the support/resistance zones depending on your trading strategy.
I cannot know how you trade or what strategy you use. You have to adapt my information to your trading strategy and first of all to your risk management.
Some simple tips for your work:
1) I advise you not to be like everyone else and not to expect super target. The target must be adequate. The smaller you set target, the more you will earn at a distance. When the price of a coin is rising through most of the volume, it is advisable to work locally up to +80%, so you will always have money to re-buy from the profits.
2) Complex % (using volatility) does its job. It can be used (the principle) not only on one coin (accumulation), but also on several coins without paying attention to the name of the coin (to accumulate profits from coin to coin). They should not be very many.
3) Remember—the level is not a line, but a zone. It is rational to work with a grid of orders.
4) If possible, protect your profits with a trivial stop loss. But do not place it too close to the main intraday volatility zone.
5) Do not work with a large number of coins, there is no need, they are all the same. Their rise in price depends primarily on the general situation on the market and in the world.
6) Take into account the phases of the market, including local character. Creators of individual crypto-funds will not raise the price against the general trend if people are afraid to buy at that time. Playing against the trend is more the exception to the rule.
There is a time to buy, a time to sell, and a time to watch. The third phase should take you the longest. Most people are only in phase one, regardless of the overall trend. Don't be like that…
7) Trade with your thought-out algorithms (trading strategy + risk management + experience), not with emotions. Those who lose money in the market—trade with emotions and ill-considered fantasies – desires.
The basis of your profit is your trading strategy and compliance with risk management based on your experience
Recommendations for trading strategies:
1) If you work in shorts, be sure to put stops and use adequate minimum leverage. Margin trading is a nightmare for an inexperienced and very greedy market participant.
2) When working in the spot on medium liquid coins, it is more rational to wait for a breakthrough in the downtrend and on the pullback after the momentum with a significant (important) buyer volume to enter the market. It's better to buy a bit more expensive, but with more confidence that the trend has changed. But, it is not a panacea, can after a breakthrough and holding the price a certain time—the continuation of the downtrend. Options for solving the problem:
a) stop loss.
b) Money cushion.
c) The first and second options in place.
3) If you really want to buy some crypto-coin before the break of a trend (you are afraid of not having enough time or you "know the exact future”), then don't buy with all the amount allocated to this coin. The first purchase (especially before a trend break) should not have a big % of the main planned volume.
a) If the price goes against your initial purchase and decreases—work martingale from the specified levels (in addition to the position) to average the average purchase.
b) If the price rises strongly by impulse, and you bought a small planned amount, then there are two options in this case:
1) Wait for a pullback and on the pullback to finish (but still not for the whole amount, you should have at least 20-30% cache at any pumping).
2) the second option, if the price has strongly increased and there is no substantial rollback—work with the volume, that is, and the rest of the money allocated to similar coins, which have not had time to grow in price.

Looking for longs from 160 towards 280One ring to rule them all.
Looks like a healthy correction, I heard Gilbert Verdian is inviting us for a party at 280.
Please share your ideas.
To rule them all.

QntusdtYou want to jump in once hits 160 levels that or once it breaks to the upside on the downtrend line. Massive distribution on the daily but oversold on smaller timeframes, this will be a dead cat bounce only. Good luck

QNT Dropping As Expected. Where NextMulti Timeframe Analysis
Hint: Five days ago we predicted the drop of our favorite coin QNT. Expect tests of up to the third fibonacci level
Bull-Bear Narrative:
1. Price is long term bullish but overbought.
2. A bullish order block spanning 139 to 160 to needs to be satisfied which will complel a bullish surge. Institutional order blocks are magnets for price.
3. First fibonacci level hit as predicted
4. Bearish Cypher, Nen Star and Gartley Harmonic Pattern on the daily. Fall targets at 190, 154, 133 and 100
5. Trader's Dynamic Index overbought.
Await a confluence signifying a rejection from key levels such as order blocks, then take a satisfying counter position. From this juncture, we update the next forecast.
Special note: QNT is one of five powerful crypto projects with far less circulating supply than BITCOIN. This coin can easily reach a 25.2k USD value per token in ten years assuming the project attains Bitcoins current market cap of #367.2B. This is a 144X from current price.
Remember: life often disrespects charts so trade with caution
------
Market order position upon the confluence of valid entry rules on the 4H or 1H chart.
-=ENTRY RULES=-
Trading philosophy: Don’t short at the lowest of the bearish momentum nor do you long at the peak of a bullish impulse. The safest entries are at the end of a retrace on the 38.2%, 50%, 61.8% or 78.6% fibonacci back in the direction of the master trend.
Note: I use Daily/4H or 4h/1H market structures with wave analysis to prep for potential entries. The RSI , MACD and EMA indictors are confirmation for entries at the 4H or 1H timeframe
For Institutional ORDER BLOCK trades:
When price reaches a bearish or bullish orderblock, ascertain the price reversal by means of
1. Dojis
2. Morning/evening stars
3. Several wicks.
4. Engulfing candles or three white soldiers in the opposite direction
5. Marbouzou in the opposite direction.
6. Break of trendline or fast EMAs
For SHORT:
4H chart should confirm that the bullish retrace had turned bearish in the direction of master trend. The MACD should have dropped below zero signifying a bearish environment. Price would have dropped below the 10 and 20 EMA . For good measure, check that the 4h and D1 RSI is below the 50 signal line
For LONG:
4H chart should confirm that the bearish retrace had turned bullish in the direction of the master trend. The MACD should have gone above zero signifying a bullish environment. Price had gone above the 10 and 20 EMA . For good measure, check that the 4h and D1 RSI is above the 50 signal line
Divergences:
The 4H, 8H and 12H chart can reveal hidden divergences on the RSI , MACD , Money Flow Index, CMFI, On Balance Volume and Stochastics. When one or more divergences manifest- be ready. Trend reversal is coming. My best practice is to wait for at least an RSI divergence on the 4H, then drop to M15 to see price shifting with a 50EMA aligned with the 4H divergence.
About me
I am not a financial advisor nor a signal provider. These are the opinions of a 20-year private trader in the legal profession as well as a businessman diversified in the tech and hospitality industries. My favored tools of the trade include wave analysis, price action on the 4H to Weekly timeframes and institutional order flow ( COT data).
In partnership with capital markets research group Plazo Sullivan Roche Capital of Mahe, Seychelles

QNTUSDTHello friends
On higher time frames, we have reacted to an important range and a downward trend has been created, but for now we do not have a signal to continue the downward trend.
The chart above is for lower time frames for a short trade
There is a high probability of breaking the descending channel (of course, it is more of a tight movement) and the price advances to higher areas.
What do you think?

QNT/USDT - LONG----- Welcome, dear followers! -----
- Here is my trading methodology. I trade with a normal system and analysis of resistance and support, as well as price reversal patterns.
- For the record, I do not place a stop loss within my trades. So that I only risk 1.5% of my total capital in order to support the loss due to a price reversal against me.
- If a price reversed against my expectation and touched the drawn line r3, then I transferred targets to the entry point and waited for the price to close at it with a loss equal to almost zero.
- Today's deal is shown in the chart, and here are the entry and exit points below.
-- Support me with numbers and follow up on my account for other deals in the future. Thank you for coming to this part. --
-------------------------------------------------------
