QNT Primed for a Bullish Run: Targets Up to $218.1💰 #QNT GETTEX:QNT
The cleanest bullish setup right now 🐃
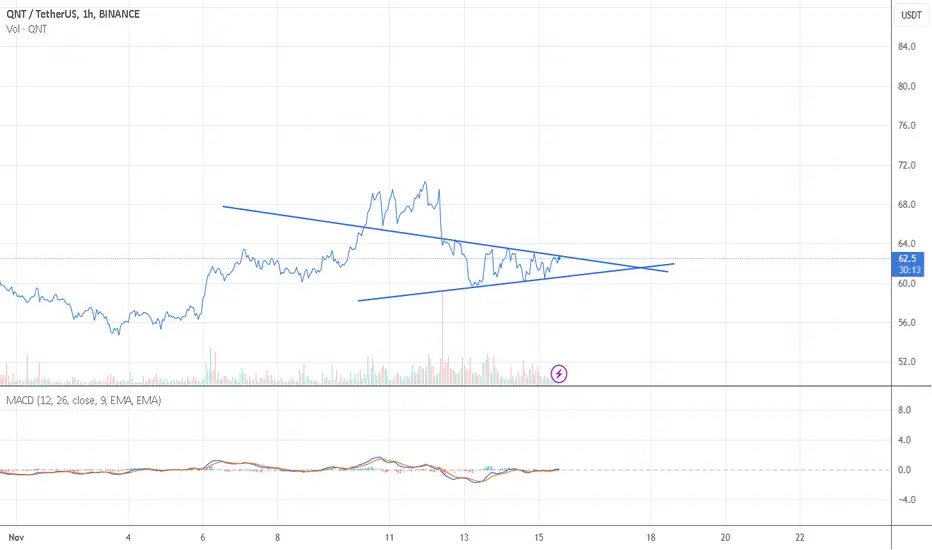
Breakout from the descending wedge + strong bounce off the support zone!
Send it 📈
🎯1 Target: $154.7
🎯2 Target: $182.3
🎯3 Target: $218.1
QNTUSDT trade ideas

QNT Ready for a New Year Rally
New Year retracements are creating opportunities everywhere❗️
#QNT just completed a harmonic pattern and is bouncing off key support zones 👀
The Fibonacci levels show strong potential for a rally to $148.1, with $187.1 and $223.3 as major targets 🎯
And my personal opinion – this move could break above $223.3 for an explosive run 🚀

QNTUSDT 1WQNT Update ~ 1W
#QNT If you still have Conviction on this coin,. This support block would be a very good buying place for now. With a minimum target of 20%+

QNT Breaks Out! Is a 64% Rally on the Horizon?QNT/USDT has broken out of a descending triangle, signaling a potential bullish move. If the breakout holds, the price could target a 64% upside, as projected by the measured move.
Watch for a retest of the breakout level and triangle support for confirmation.

QNT LONGOur proprietary, AI-driven stock prediction model has identified BINANCE:QNTUSDT as a potential trade opportunity. This setup aligns with our established criteria, including:
+ RSI Divergence: Momentum indicators signal a possible trend reversal, with bullish divergence observed in the RSI.
+ Decreasing ATR: The Average True Range remains low compared to its historical levels, suggesting reduced volatility and more stable price action.
+ Positive Volume Profile: Recent volume accumulation supports the likelihood of upward momentum, reflecting increasing market interest in PPG.
Trade Parameters:
+ Take-Profit: Guided by our “25UP” predictive model, which identifies optimal exit points amid evolving market conditions.
+ Stop-Loss: Determined by our “25DOWN” model, proactively managing downside risk to protect capital.


QNT Take Long Positionthe end of ABC correction is now
But expecting some chop in support but if 1D not close below trendline its ok to take long position

Long here bouncing off supportyou cant see it because trading view wont let me use the 10m interval (no premium) and 5m is too large for the screen but there was a quick price drop (what word am i looking for lol) on the 9th december to this level. i have bought here using ondo profit and am expecting a bounce. looking for higher lows now.

QNT must make a correction After breaking down the upward channel i expect QNT to reach rhe price range of 120-117$ which can be a very reliable entry point because it is now a weekly support zone.
The second best entry price can be around 108-106$ which is on a daily support.
DYOR
Goodluck

QNTUSDTWe can attempt to buy QNTUSDT from specified level as it makes HL , also 0.618 FIB level intact indicate that it moves upward.
SL , TP mention in chart

Here I buy Quant at $160Now It's time to buy Quant at $160
And my buy price is starting at $160 with market orders
And Quant supply shock is happening at $160
Supply and demand are fascinant thing, not only for assets
Your words for example, they also have supply and demand law
when you talk less, your words become scarce and gain value
but when you talk too much BS your words become frequent and lose value
that's why they should avoid talking about some things, mainly the ones they have no clue about
like bitcoin and crypto price action.

#QNT (SPOT) entry range( 53.7- 61.7)T.(131.8) SL(50.0)BINANCE:QNTUSDT
entry range ( 53.7- 61.7)
Target1 (81.9) - Target2 (131.8)
SL .1D close below (50.0)
Golden Advices.
**********************
* collect the coin slowly in the entry range.
* Please calculate your losses before the entry.
* Do not enter any trade you find it not suitable for you.
* No FOMO - No Rush , it is a long journey.
Useful Tags.
**********************
My total posts
( www.tradingview.com )
1Million Journey
( www.tradingview.com )
( www.tradingview.com )
********************************************************************************************************************** #Manta ,#OMNI, #DYM, #AI, #IO, #XAI , #ACE #NFP #RAD #WLD #ORDI #BLUR #SUI #Voxel #AEVO #VITE #APE #RDNT #FLUX #NMR #VANRY #TRB #HBAR #DGB #XEC #ERN #ALT #IO #ACA #HIVE #ASTR #ARDR #PIXEL #LTO #AERGO #SCRT #ATA #HOOK #FLOW #KSM #HFT #MINA #DATA #SC #JOE #RDNT #IQ #CFX #BICO #CTSI #KMD #FXS #DEGO #FORTH # AST #PORTAL #CYBER #RIF #ENJ #ZIL #APT #GALA #STEEM #ONE #LINK #NTRN #COTI #RENDER #ICX #IMX #ALICE #PYR #PORTAL #GRT #GMT # IDEX #NEAR #ICP #ETH #QTUM #VET #QNT .

Quant (qnt)Qnt usdt analysis
Time frame hourly
Risk rewards ratio >2
First target 114$
We have a resistance area in 98$
If qnt can break this resistance range , it can hit my first target on 114 $ and qnt has no pressure to 135 $
The next strong resistance is on 135 $

#QNT/USDT#QNT
The price is moving in a descending channel on the 4-hour frame and it was broken upwards
We have a trend to stabilize above the moving average 100
We have a downtrend on the RSI indicator that supports the rise by breaking it upwards
We have a major support area in green at a price of 58.00
Entry price 63.90
First target 71.60
Second target 76.50
Third target 82.90

QNTQNT-USDT
Buy entry from the price of $101.5🟢
Objectives:
$114.8
$162.5
Stop loss:
$90
Remember, enter with a portion of your capital. If there is a correction, we will support it.
Rule of averages

Trading opportunity for QNTUSDTBased on technical factors there is a Buy position in :
📊 QNTUSDT
🔵 Buy Now
🪫Stop loss 89.000
🔋Target 1 107.000
🔋Target 2 120.000
🔋Target 3 149.000
💸RISK : 1%
We hope it is profitable for you ❤️
Please support our activity with your likes👍 and comments📝

#QNT/USDT is holding the trendline so far in 4-Hour TF!#QNT/USDT is holding the trendline so far in 4-Hour TF!
Waiting for a tap towards 4H bullish Order block to long $QNT. The local resistance level is PWH $108.75 and the support level is PWL $79.25.

Hello to QNT
As always, we start with cycles
hwc=uptrend
mwc = upward but weak trend
lwc= rang
According to the cycles, I give priority to the long position🧐
Tips for long positions 📈
1,Our cycle tends to go up
2.The volume is decreasing when it falls
That's enough for me for a long position
By breaking the trend line
And the failure of 96.3, we can take a long position, definitely 96.3 is the safe entry point
And the trend line is more risky
For shorts position📉
For shorts, the only thing we see is the weakness of MWC, which could change the trend
I wait for the short position and wait for it to reach the safe entry point
High risk entry point 91.5
And 83.8 is safe
If you want me to analyze a coin, tell me in the comment🫡
⚠️ Do capital management to survive ⚠️

Trading opportunity for QNTUSDTBased on technical factors there is a Buy position in :
📊 QNTUSDT
🔵 Buy Now
🪫Stop loss 89.000
🔋Target 120.000
💸RISK : 1%
We hope it is profitable for you ❤️
Please support our activity with your likes👍 and comments📝

QNT gave bullish signal Hi,
QNT brokeout $82 and tested the resistance level which is the key level of the price action, first target is $136 and the second target is $195.
happy trading,

QNTUSDT Is a Bullish Breakout or Bearish Fakeout—What’s Next?Yello, Paradisers! Is #QNTUSDT gearing up for a powerful rally, or could we be on the brink of a deeper pullback? Here's what you need to know:
💎#QNT has shown signs of bullish strength by breaking above a key resistance level, which has now been retested as support. If the price continues to respect this support, it could signal a bullish continuation. The next critical step for confirmation is a break above $95.6, followed by a daily candle close above this level. If this happens, we could see QNT pushing toward its major resistance target in the next leg upward.
💎If the support fails to hold, there’s a risk of a fakeout, with QNT potentially dropping toward the $70 demand zone. This level is crucial for sustaining any bullish momentum. A rebound from here would be necessary to reclaim the support at $82, allowing the bullish scenario to remain in play.
💎Should QNT break below the $70 demand zone and close beneath it on the daily chart, it would invalidate the bullish outlook. This could lead to further downward pressure and a deeper correction in the coming sessions.
Remember, Paradisers, the market is a game of probabilities, not certainties. Always trade with clear confirmations, and never let emotions dictate your strategy. Play it smart and stay disciplined!
MyCryptoParadise
iFeel the success🌴

looking for qnt to do something one daydrawing some lines so i can monitor qnt behaviour as i am looking for qnt to do something one day
Quant is breaking the downtrend and targeting $71The AI token QNT/USDT is targeting $71. $71 BINANCE:QNTUSDT
