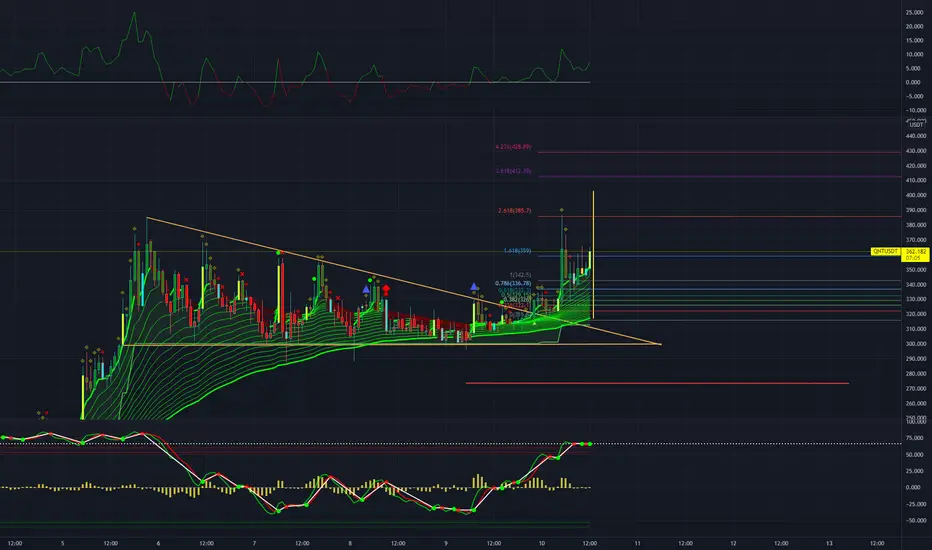
QNT/USDT Not at the Mercy of BTC Part 2I am updating my part 1 of QNT/USDT from a couple hours ago. It looks like QNT has reached the 2.618 but still remains bullish. It looks like it may continue to go up further as time goes by. The first analysis saw a bullish pennant indicating a bullish continuation. The yellow line is how far the price is willing to move based on the shape of the bullish pennant. The red line below the triangle is 1.618 if it breaks support.
QNTUSDT trade ideas
QNTUSDTQNT break big flag and retest it , buy here for big profit , risk per reward is low here , please use stop loss .

QNT/USDT Not at the Mercy of BTC?I am looking at the 1 hour time frame for QNT/USDT. It looks like a bullish pennant and if it breaks the the top side, we can expect a small bounce back to the top of the triangle for support and continuation to the upside as long as the entire market remains bullish.
The yellow line is the length of which how far the price can move forward once it breaks resistance. The red line below the triangle is the 1.618 target after it breaks support to the downside. A bullish pennant is a technical trading pattern that indicates the impending continuation of a strong upward price move

QNTUSDT🌟lets explain some info for those who seeks some learning instead of whole free signal idea
🌟look carefully to all those shadows in the highlighted area in the chart, if you have some basic information from price action and candle sticks, you will understand that in this area due to the "must dump" situation in follow of BTC domination, the chart should collapse and lose a lot of value but instead the chart tends to lose less and make it in a shadow form of a candle, so what would be the analyze of this small observatory point? this means the investors are not related to whales (yet) in this chart and the retail investors are in the front seat of this coin
🌟so why do we enter position when as your team quotes "its not whale related and these things" we don't have this coin on their watchlist so we don't going to have a huge money injection!?
the answer is easy, whales are not going to have it on their watchlist till it stables as a chart with their factors (which this coin is almost passed all of them and soon is valid for becoming a whales watchlist coin) after that we will observe the follow of the chart to be like all the other coins with similar correlation ratio and what did we expect from them to do as the controller of the alt coins? yes injection of money
👉This idea has the confirmation of "advanced price action" 👍
👉Follow us and invite your friends too, this way we can share ideas and signal to anyone we care 👍
👉Hit share and spread the information in public chats or your twitter for everybody to get profit 👍
👉Tell us what's important for you in the market or what asset makes a difference in your investment basket 👍


QNT// UpdateStrong accumulation in the buy zone, after forming a nice descending triangle. This could be the start of the next leg, more details in vid.


QNT// Update Blood in the water, however QNT has held its strength. Currently forming a decent range. Now is not the time to be afraid to trade...this is usually when the best opportunities present themselves.
Worse case scenario on an entry at the lower half of this range will be a breakthrough from the bottom and a retest of this then broken zone. ONLY on the retest will you actually want to exit. A pair that is moving like QNT right now will have some buying pressure on a break.
Also, another thing that may have saved QNT would be because of the limited amount on exchanges. Regardless, I think it may be obvious which pairs hold strength right now...the best option is to buy into strength rather than put a bet on a random shitcoin that plummeted 30% to pull back 90...while it is possible, following strength is the best and safest move right now.


Quant another leg up to 433 incoming ?Seems like after the strong move over the weekend QNT is consolidating in a bullish Penant. Expecting a move to 433 next. GOod luck trading. It’s a long term hold for me but I look to TA patterns to dca.

🔥 QNT Price Discovery: Sky Is The LimitQNT is one of the more recent coins that has been released on Binance. It's also one of the few coins which has been performing exceptionally well since its introduction on Binance.
As of today, QNT has broken out of the rising channel pattern in which it has been trading, launching the token into price discovery mode. Some crazy things can happen over the next couple of things. Manage your risk accordingly.
My main target area is the area around $330, which is based at the 2.618 Fibonacci extension.
Be aware that there's a chance for QNT to re-test the area between $260 -$230 again, which is the area around the top trend line of the bullish channel.
Happy trading!

Missed out on BTC and ETH? No worries, there is QUANT!After more than 100 days of mostly bearish posts; I have finally turned bullish since the last 2 weeks! I have been wondering to put this out here already or keeping it for myself for little longer but you know, I'm a nice guy - sharing is caring! Now I am not a moonboy but a rather realistic investor and trader that doesn't like to lose money (I sold BTC at 64K ) nor do do I have the habit of creating moonposts. However, for Quant (QNT) I make an exception. In my opinion (!) this will be a top 20 coin by next year and potentially even a top 5 coin within the next 2 / 3 years. There are a lot of people that dont know about Quant and moreover most people do not know this coin, so I will try to explain why I'm mega bullish on this coin and why you are investing in a baby BTC or baby ETH with around a 2 billion usd market cap.
What is Quant?
Quant launched in June 2018 with the goal of connecting blockchains and networks on a global scale, without reducing the efficiency and interoperability of the network. It is the first project to solve the interoperability problem through the creation of the first blockchain operating system.
Why am I bullish on Quant?
I am bullish on Quant because of four reasons:
Connecting the world to any blockchain with Overledger
Solving the problem of interoperability connecting not only different blockchains with each other but also the "current non-blockchain infrastructure" with the blockchain industry. That means with Quant, financial institutions, corporates and small businesses can make use of Overledger to connect to the blockchain. So simple example: you have a webstore and want to accept Bitcoin AND Ethereum payments; with overledger combined with AWS marketplace (they are partners) you can. In Short Quant offers the first SAAS that connects you to any blockchain.
Quant will provide institutional adoption to blockchain
Quant collaborates with tech giants such as AWS, has great connections with governments in Europe and is founder member of the European Union's International Association for Trusted Blockchain Applications (INATBA). That sounds great but there's more; Quant is partner of IT/hosting giant Oracle . So what? I'll tell you; Oracle is hosting the new SWIFT standard: ISO20022 that launches in November this year. I have reason to believe LINK has something to do with it too (although its dubious speculation) but moreover; QNT could be THE favored blockchain to run CBDC's. Why? Well lets look at the founders of Quant:
Gilbert Verdian , one of the founders of the Quant network, had the idea for the blockchain project while he was working in the healthcare sector. Verdian identified the importance of interoperability in ensuring that patients registered on different platforms are covered. Verdian has over 20 years of industry experience in upgrading the security, technology and business strategies of businesses around the globe in order to achieve tangible results. Prior to the Quant Network, Verdian served as the chief information security officer (CISO) of Vocalink, a Mastercard card company, the chief information officer of NSW Ambulance, the CISO of eHealth NSW, and the security lead of the Ministry of Justice, UK.
The second co-founder, Dr Paolo Tasca , is an entrepreneur, digital economist who specializes in distributed systems. Dr. Tasca has served as the special advisor on blockchain technologies for the EU Parliament, the United Nations and numerous central banks worldwide. He is also co-author of several books on fintech and is the co-founder and governing board chair of Retail Blockchain Consortium.
Catching my drift here?
Token Economics
If the fundamentals weren't bullish enough just yet, I mean let me repeat again; we are talking about the first real (OS) operating system that runs on ANY blockchain. We have insane token economics with a max supply of 14,6 million (no new tokens will ever be minted) which makes them more scarce than Bitcoin. Next to that more than 88% of the supply is on the market so there will be no insane surprises seen at other blockchains were the founding teams can dump 25% of the supply on the market (in the future). Next to its scarcity, the Quant token will be used as an utility token to perform numerous actions on Overledger; think of transaction fees, staking, running dapps and much more. The current token distribution and market cap looks as follows:
Market Cap: $2,315,960,464
24 Hour Trading Vol: $58,003,748
Fully Diluted Valuation: $2,608,109,074
Circulating Supply: 12,975,667
Total Supply: 14,612,493
Max Supply: 14,612,493
Technical analysis
With such a low market cap, insane fundamentals and token economics; you don't have to be Warren Buffet to understand the growth potential of this token. You also don't have to be a genius to understand that for the coming few years QNT will outperform both BTC and ETH - and in my opinion (!) most other tokens in the market. Believe it or not but this is why I allocated most of my portfolio into QNT. Yes sure, Ethereum does a little better since a few days because of EIP-559 but it wont prevail. The market pushes BTC first, then ETH, then smaller tokens. QNT just got released on both Binance and Coinbase and is still to be opened for trading for most countries on the latter. The result was that QNT roughly did a 150% run since late July.
Would it be fair to say that QNT could reach the same market cap as DOGE coin in the coming 2 or 3 years given its use case in the real world and the influx of institutional investors and the potential rumours of Quant based CBDC's? Not unheard of right? Well, that is a 13x in the coming 2 / 3 years. See that chart on the left? There I kept it mild and drew out a 8x in the same time period and a 45x by 2026 (personally I think it will do much more than that but let's keep expectations low), given crypto will have found its early "mass adoption" use cases in applications such as CBDC's, oracles and why not an operating system that runs interoperable across the whole space?
To me it makes a lot of sense and I bet that would be the same for the likes of whales, institutions and retail at some point. I have seen some on chain metrics that top ETH whales have been accumulating and I understand why; they can collect a lot more ETH with QNT - if that is your thing. On its launch on Bittrex QNT already hit 1000 usd and hit a (hold your breath) +28,000% against ETH. (Yeah, you read that right - see the chart on the right). Sure, that is some spastic starting craze, yes but you should understand that liquidity has been tested at these levels now; it will likely return there over time. Our FIB extension on the left chart shows us insane potential on the right chart and ofcourse that would take its time (way longer than the few months displayed on the chart). Whether it is next year or in 3 years, I don't really mind because I know QNT is a token to hodl for the future and the future is the blockchain economy.
NOTE: please support my research and TA with a like, comment or a follow so more people can be educated about the crypto markets and receive realistic, free and transparent technical analysis! If you would like to join our community, you can do so through the link on my profile page. Good luck and trade safe!
IMPORTANT: this is not financial advice, trade or invest based on your own risk and research.

QNT: inverted cup and handle, +40% incoming!QNT UPDATE: after a period of bullish consolidation around the highs and solid support in the 150 usd zone, Quant is ready to take off and take out the 200 dollar zone. I am super bullish on this coin, you can read why in my full analysis below, massive fundamentals and partnerships paired with insane token economics! At the moment we see a new impulse creating an inverted cup and handle with a roughly +40% target over the next week or two.
IMPORTANT: this is not financial advice, trade or invest based on your own risk and research.

QNT/USDT Long Set upLONG set up QNT/USDT entry start DCA from 1.795 to 1.778 low leverage / Stop Loss 1.73 (3.60% risk)
TP1 1.84 TP2 1.873 TP3 1.917
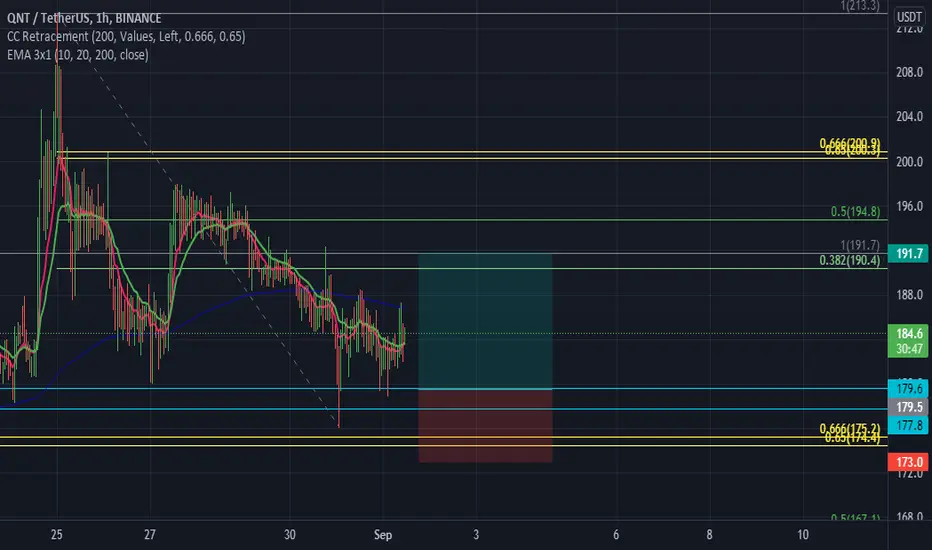
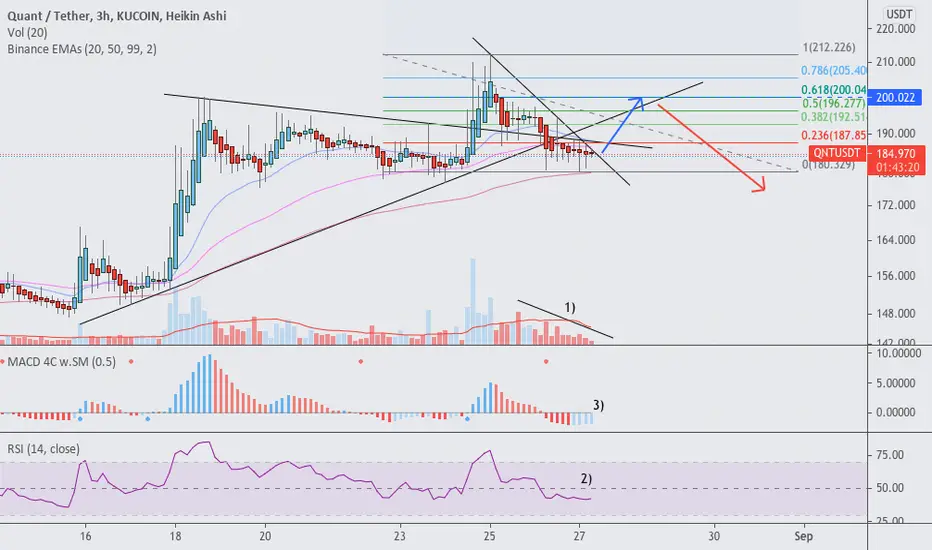
A short term bounce but more selling to come for QNTIn the short term we can expect a bounce back to the 618 Fib from here. From the volume profile 1) we can see selling decreasing. Momentum shows to be turning from the MACD divergence 3) and the RSI starting to curve up near the lows 2).
The medium term picture still seems to suggest more selling to come. On the daily, we have ultra high volume bars near the highs, which we can assume to be selling. We would like to see a crossover on the MACD 2) and for the RSI to come down at least to the midway point. We can look back to the previous correction that lasted several weeks and anticipate something similar, into September.

technical analysis QNTUSDTKUCOIN:QNTUSDT
p. QNT is making a nice cup and handle and triangle looks like it is at the end of accumulation. For new entry or averaging up, buy on breakout / pullback after breakout.

Quant is unstoppableIt won't stop, it cannot stop. QNT is making a nice cup and handle and looks like it is at the end of accumulation. For new entry or averaging up, buy on breakout / pullback after breakout. I personally put quite a sum of my bag here and hodl

SWING TRADE - QNTUSDT - LONG POSITIONPAIR: QNTUSDT
Price Is Resting On 0.236 Fib Level(Price: 183.5), It Is A Good Potential Buy Zone. At The Same Time Price Is Touching 20ema And Rsi Is Above 50 In 45mint Time Frame. Level 182.6 Has Shown A Good Support From 18th August.
Entry: 183.0 To 184
Stop: 176
Take Profits:
Tp1: 190
Tp2: 192.5
Tp3: 195

QNT// Round 2 (Update)Late post as I had a daily post limit
After having a huge impulse move hitting the final target. Price has retraced into a falling wedge . Similar to the initial move, bearish in nature, however it is a bullish accumulation as the volume in candles drops as it nears the bottom of the wedge .
Currently on the 1H we have a wedge forming and holding decent support at the 61% zone. This area could be a good place to add bids. This area would be a zone that was broken and is now a R/S flip.
One thing to keep in mind is that when BTC is pumping, QNT tends to consolidate a bit, and such is the opposite in a BTC pullback. After the recent wedge break to the upside on BTC , its only right price pulls back a bit. If we get this pullback on BTC its likely QNT will break this wedge and we have another leg up.
Both biases are shown however, Im already in longs and added during this small range we are in.
Previous analysis linked.


QNT break resistance trendline !!!QNT has broken the trendline resistance, I think the price may retest first, maybe not, if the price retests then it's a good time to buy.
Always maka your analysis before a trade....
If you have any questions write in the comments collomn.
