IGRDthe chart shows a technical analysis of Estithmar Holding (IGRD) on a weekly timeframe, using Elliott Wave theory and Gann/Fibonacci angles to predict potential price movements.
Key Observations:
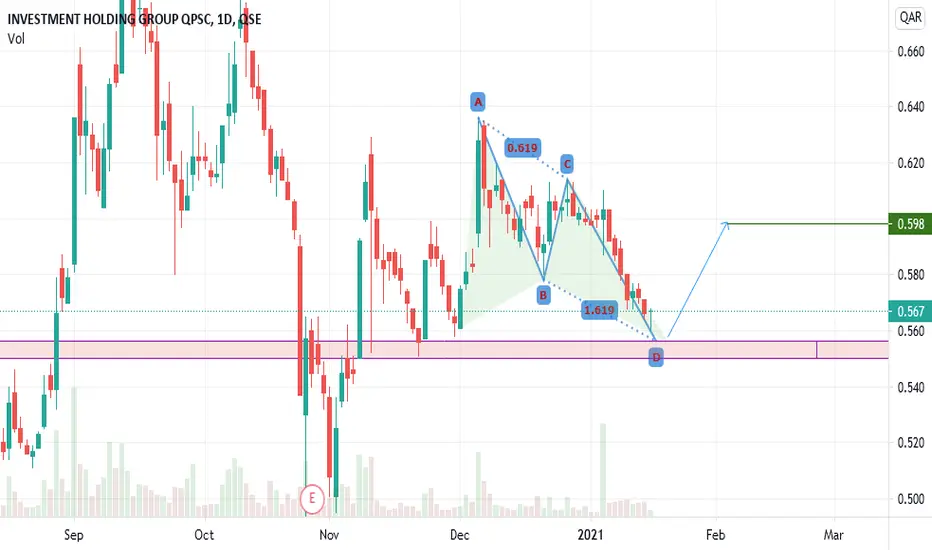
Elliott Wave Pattern – ABC Correction:
The chart suggests that the stock completed wave B at a recent high.
A downward corrective wave C is anticipated, as shown by the red dotted line.
Bearish Divergence:
At the bottom, a momentum oscillator (likely RSI or a similar indicator) shows bearish divergence – price is rising, but momentum is falling.
This is typically a warning signal that upside momentum is weakening.
Downside Price Targets (based on Gann/Fibonacci angles):
Possible support levels:
2.15 QAR
1.93 QAR
1.71 QAR
1.49 QAR
Final target: ~1.06 QAR (as the lowest projected level)
Warning Highlighted:
The red text at the top: "IGRD – Estithmar Holding – See explanation below"
This suggests a bearish outlook unless key resistance levels are broken with strong volume.
Summary:
Current trend: Overbought with signs of weakness.
Outlook: Bearish correction likely.
Action: Watch for confirmation of a downtrend or support at key Fibonacci/Gann levels.
IGRD trade ideas

IGRDTrading is hard and it’s not something you can expect to get good at overnight. So if you’re serious about becoming a master of making money on the markets, you’re going to need some top-level schooling. #IGRD #qatar

Quick analysis on IGRD *READ BELOW*Dear Qatari traders, as you can see on the chart we have the price pulling back on the VWAP, what you're going to do I's to wait for the 1st 15 min green candle to come above the VWAP then you get in.
For further questions or information don't hesitate to leave a comment.

Recap of today's tradesGood afternoon dear Qatari traders!
Congrats to those who have bought the IGRD, I posted yesterday some analysis of different markets you can check by getting in my account, 2 markets went as expected and the others still consolidating or following the market algos.
Follow for more analysis on different markets!
Don't hesitate to ask your questions if you have any!
You can ask about analysis on any market you want in the comment section!

Quick analysis on IGRDAs you can see on the chart, the price did a fake breakout of the VWAP before coming up to follow the it on its up trend.
TP and SL set them at your own risk!

forecasting ESTITIMAR HOLDING in dayli chart Hello to all investors, according to my previous studies and according to my experience as a trader, I see a good investment opportunity with a high probability of success, the details are reflected in the graph


IGRDIGRD ,
I think the stock will remain sideways until mid-October. During that period, there will be a sideways movement sometimes, but the general trend is to the downside

IGRD Daily TimeframeSNIPER STRATEGY
This magical strategy works like a clock on almost any charts
Although I have to say it can’t predict pullbacks, so I do not suggest this strategy for leverage trading.
It will not give you the whole wave like any other strategy out there but it will give you huge part of the wave.
The best timeframe for this strategy is Daily, Weekly and Monthly however it can work any timeframe above three minutes.
Start believing in this strategy because it will reward believers with huge profit.
There is a lot more about this strategy.
It can predict and also it can give you almost exact buy or sell time on the spot.
I am developing it even more so stay tuned and start to follow me for more signals and forecasts.

IGRD - IT IS TIME TO BULLISH?Note : If you have any questions, feel free to send me message
Please give your comment/idea. Thanks
Greetings
Humbled, we would like to thanks for your support who has already liked, commented and followed us. Your support, strengthens us, to help in analyzing the market. If you have any questions, feel free to send us message (inbox).
Pra Trading :
- Please care for Money Management
- Have a good psychology
- Do not be hurry to open position and do not do nothing if u see opportunity
- Evaluate and upgrade your trading plan
Execution Strategy :
- Know what you want to buy, see the Fundamental
- Decide that you are on investing or speculating
- Consider what your strategy based on Investing/Speculating
- Make Road Map Of Your Trading Plan
- Decide
a. Entry strategy
b. Cut loss
c. Target of Profit
Post Trading :
a. Do not be sad if you loss or do not be very happy if you win
b. Just become a normal without emotion, Do not put emotion into your trading
c. Evaluate your trading
d. Keep on Learning
e. Be Humble
Idea : IGRD - IT IS TIME TO BULLISH?
Note : If you have any questions, feel free to send me message
Please give your comment/idea. Thanks


IGRD (QSE) - Still in bearish trendHumbled, we would like to thanks for your support who has already liked, commented and followed us.
Your support, strengthens us, to help in analyzing the market.
IGRD (QSE) - Still in bearish trend


IGRD - ready to breakoutHeavy accumulation of IGRD since 6 October.
Just a matter of time to break-out the resistance level and fly with high volume.


