QTUMBTC trade ideas

qtmbtcmid term possible scenario for qtmbtc
wait for c wave in flat pattern.
do not forget about your SL

$QTUM, Trying to flip ~21k sats resistance level into support$QTUM
Lagging on movements vs other Altcoins, Trying to flip ~21k sats resistance level into support
If happens, then aiming for Descending trendline on the daily chart (~25k / 28.5k)
UCTS Buy signals on the daily and lower TFs
#QTUM

QTUM Bullish Crab PatternQTUM is forming Bullish Crab Pattern, which already hit first target. If you wanna trade this Pattern again, try to catch retrace of first impulsive wave like you can see in chart. Targets, StopLoss, buy zone is written in chart. This Cryb pattern is precise and price action in PRZ was excellent :)

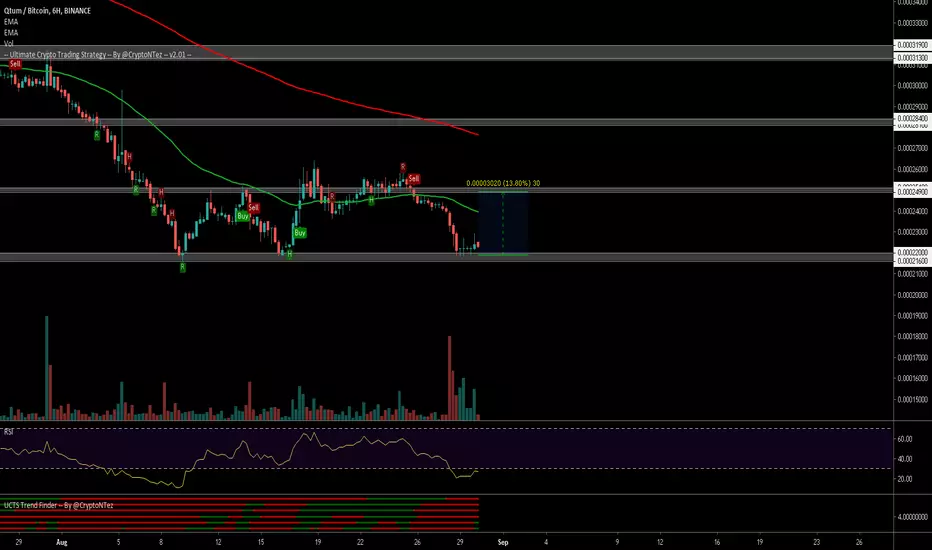
$QTUM, Sitting over support at ~22k Sats...$QTUM
Sitting over support at ~22k Sats, previous iterations with this level lead to a bounce back to 25k sats (13% movement)
RSI at oversold levels (leaving this could be a first signal)
Volume started to show good activity (Volume preceeds price)
#QTUM

Qtum Buy Setup- Price is now going with dynamic support.
- Expecting its boom soon.
- Try to take entry at 250-253.
- Take profit at 275-284

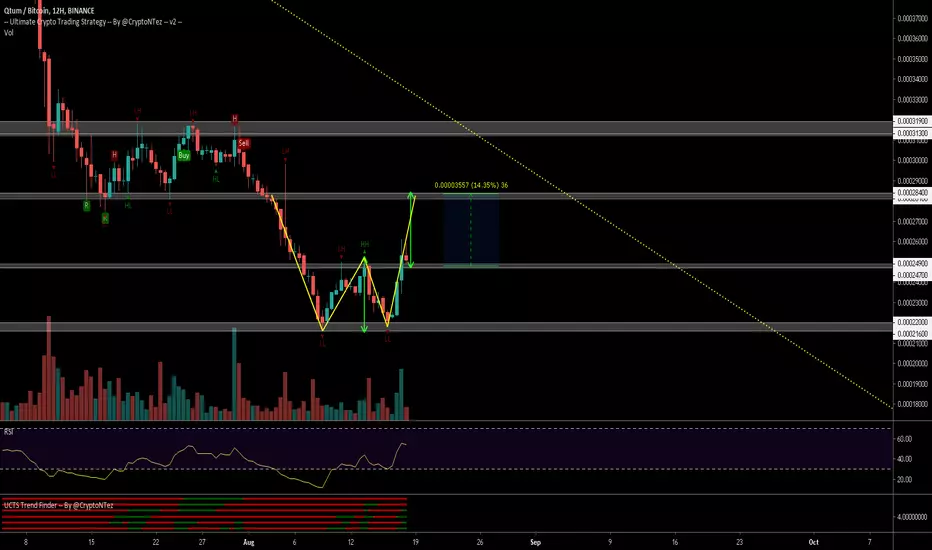
$QTUM, Showing a double bottom pattern about to flip ~25k sats $QTUM / $BTC
Showing a double bottom pattern about to flip ~25k sats resistance into support for a new leg up to ~28K sats (~14%)
Volume rising, MACD showing a bullish divergence while UCTS showing buy signals on 6H or lower timeframes...
Let see how it evolves..
#QTUM
QTUMBTC 7/19QTUMBTC
Buy 0.000295/0.000285
Targets
0.000307
0.000320
0.000330
0.000415
Hold
Stop_loss:0.000279
Risk:5%
Invest:3%
we ask Allah reconcile and repay


alts deads - Qtum shortmissed break of support line around 0.00037
looking to open short around same area
will open if rsi bounces off 50 and 21 day ema closes below 50
open = 0.000369
target = 0.000329
stop = 0.000374

Long on QTUM/BTCDecreasing price and volume signifies there is a higher probability of a bullish move

Qtum uptrendUptrend is confirmed. 2 final crash to shakeoff all stop losses. Went into accumulation. Giving daily higher highs. Simple charting as usual.

QTUM LONG$QTUM
I'm liking the volume we've seen over the last week, CCI turning positive on the daily. Could see a retest of green support, then I think we'll head for yellow POC above.

QTUM Long - Strong support**Will check on BTC Dominance **
- 14 day avg Volume Rising
- Rsi bullish if close over 50
- ichimoko cloud crossed
- 21 ema crossing 50 ema, confirmed if 89 day crossed

Buy the pullbackCalled this not too long ago and it's broke a very long down trend on the daily buy the pullback and ride the next rip up gl!.

QTUM TUM TUM TUM-Reasons for trade:4hr
-bullish rsi divergence
-Upticking histogram
-macd bull cross
-Daily Hammer
-Ascending Triangle bull break
Target:
-1.618 Fib Extention
-Be sure to move stoploss to average entry when Take-Profit 1 is reached to make this trade risk free.


QTMBTC S/R Flip UpdateHello all!
We can see on the H4, that QTMBTC successfully landed on the support side after a successful rounded retest.
I've scribbled the general outline above.
A long here into previous support (around 5245) for a 15% gain would be a successful execution of this idea.
Stop below new found "support". Idea would be invalidated below this point.

Qtumoon :-)
´´´´´´´´´´´´´´´´´´´´´´¶¶¶¶¶¶¶¶¶……..
´´´´´´´´´´´´´´´´´´´´¶¶´´´´´´´´´´¶¶……
´´´´´´¶¶¶¶¶´´´´´´´¶¶´´´´´´´´´´´´´´¶¶……….
´´´´´¶´´´´´¶´´´´¶¶´´´´´¶¶´´´´¶¶´´´´´¶¶…………..
´´´´´¶´´´´´¶´´´¶¶´´´´´´¶¶´´´´¶¶´´´´´´´¶¶…..
´´´´´¶´´´´¶´´¶¶´´´´´´´´¶¶´´´´¶¶´´´´´´´´¶¶…..
´´´´´´¶´´´¶´´´¶´´´´´´´´´´´´´´´´´´´´´´´´´¶¶….
´´´´¶¶¶¶¶¶¶¶¶¶¶¶´´´´´´´´´´´´´´´´´´´´´´´´¶¶….
´´´¶´´´´´´´´´´´´¶´¶¶´´´´´´´´´´´´´¶¶´´´´´¶¶….
´´¶¶´´´´´´´´´´´´¶´´¶¶´´´´´´´´´´´´¶¶´´´´´¶¶….
´¶¶´´´¶¶¶¶¶¶¶¶¶¶¶´´´´¶¶´´´´´´´´¶¶´´´´´´´¶¶…
´¶´´´´´´´´´´´´´´´¶´´´´´¶¶¶¶¶¶¶´´´´´´´´´¶¶….
´¶¶´´´´´´´´´´´´´´¶´´´´´´´´´´´´´´´´´´´´¶¶…..
´´¶´´´¶¶¶¶¶¶¶¶¶¶¶¶´´´´´´´´´´´´´´´´´´´¶¶….
´´¶¶´´´´´´´´´´´¶´´¶¶´´´´´´´´´´´´´´´´¶¶….
´´´¶¶¶¶¶¶¶¶¶¶¶¶´´´´´¶¶´´´´´´´´´´´´¶¶…..
´´´´´´´´´´´´´´´´´´´´´´´¶¶¶¶¶¶¶¶¶¶¶…….

Qtum/Bitcoin (June 30) #QTUM $QTUM #BTC $BTCAccumulate : 430-440
Sellzone : 500-570
Holdzone : 720-760-2420-4100
Stoploss : Under 400

QTUM continues bullish reversalQTUM has checked nearly every mark when it comes to a bullish reversal. One of the only barriers left is its previous local high of 50,300 satoshis. If we manage to break through I expect a very good breakout.
