Accumulate for Nov 1st - Coincide With Bitcoin-Self explanatory chart
-Begin accumulation at these levels
-Personally holding for long term/reassess when QTUM releases a new roadmap
-High potential for short term profit - essentially awaiting volume
Hold anything in the top 10-25 or big 5 and you will do more than okay...
BTC chart published over a month ago - for reference.
QTUMBTC trade ideas

Analytics QTUM/BTCThe project has big plans for the future obviously. It’s indicated by today's coin listing at Poloniex. However, this did not have a serious impact on the rate. The price is in the zone of interest of the Buyers now. The historical chart shows that it was a powerful growth momentum at this level.
This asset is very fast – it’s growing and falling rapidly. The resistance levels indicated on the graph are very weak. The chart shows only two zones where the price was delayed:
0.001873-0.002167
0.000707-0.000650
Pay attention to how the trade in these areas: an asset with very high risks, so do not forget to put stops in both directions.
We remember that there are two levels where the price fell in an upward trend.
0.000400
0.000200
The rate of the coin is smooth, which should alert even more - the price can move powerfully in any direction.


[QTUM/BTC] %50 + ROI POSSIBLEPrice hit support line, there's a possibility we might see a price spike in price.
Stop loss;
6000 levels.
Sell target:
11000 levels.

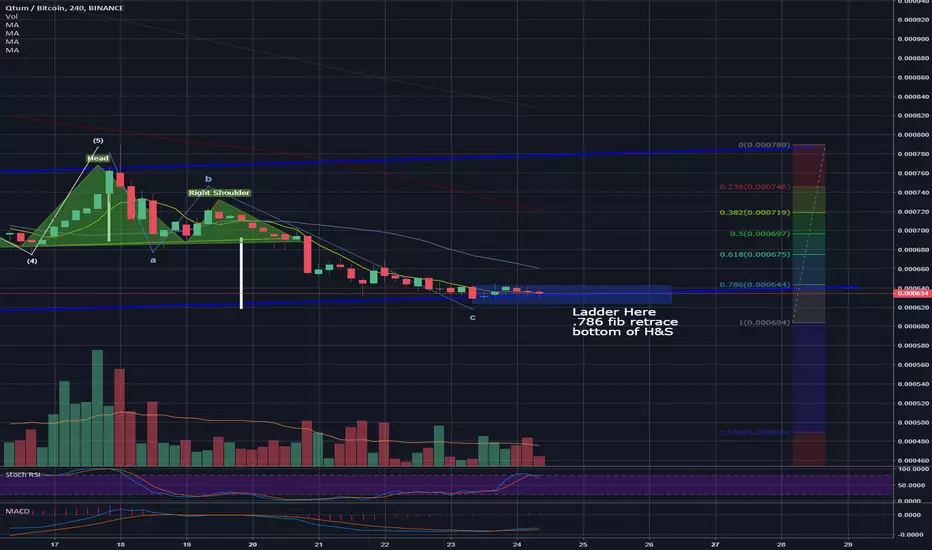
QTUM - Completed 1,2,3,4,5 impulse
Formed a H&S during the A,B,C retrace.
Completed the retrace to distance required for a H&S.
Retraced to the .786 fib
MACD is crossing over.
????
RSI is showing over bought CAUTION
Ladder in in case it drops
Technical Analytic for #QTUM (28/08) - CryptoStation#QTUM (QTUM/BTC)
Buy : 655-665
Flash Sell : 670-680-690-700
Short Sell : 710-720-730-740-750
Stop : 650
Follow me for more signals
Inbox me for more and more signals


QTUM - break out approachingQtum is still falling but the recent signs are encouraging for the bulls. The price action has been declining for three months now as the trend line keeps the price below it. Since the beginning of May, Qtum is creating lower lows and lower highs, which means a downtrend is taking place. However, it is testing the trend line more often now which is one of the signs of an incoming breakout. If that happens and the price closes above the trend line, it is expected to see higher price in Qtum in the coming days/weeks. The first resistance to be tested is 23.6% Fibonacci retracement, followed by the 100 DMA around 0.001320. Any move below the trend line again is a signal that a false breakout has occurred.

QTUM/BTC//Patron CRAB/search(PRZ) area of supports/DivergenceQtum is forming CRAB pattern extended miu interesting in levels of reversion zone
we hope to have a reaction from the alcoins .. in the coming weeks
make positions. staggered
week full of profit- (comment) your technical / fundamental point of view
Greetings friends

QTUM BTC 1 DAY BINANCELAST TIME BULL RUN PROPPERLY WORK ON CHART PATTERN 105% BULL ACCURATE
NOW DOWN TREND IS COMPLETING THE CHART PATTERN
BEST FOR BUY TIME IS COMMING
0.00065000 IS 1ST SPORT LEVEL
0.00025000 IS 2ND SPORT LEVEL
THIS IS BEST PRICE FOR BUYING


QTUMVTC 21.7 Update New SLNew Stop Loss on 0.001083
What are your positions? Share with us in a comment!

QTUMBTC 19.7 Update New SLNew Stop Loss on 0.001167
hat are your positions? Share with us in a comment!

QTUM-BTC: a continuing downtrend.QTUM-BTC frame 4h
It shows a continuing downtrend.
However, it will rise before going down to around 1028.
Be careful!

QTUMBTC 19.7 Update New SLNew Stop Loss on 0.001210
What are your positions? Share with us in a comment!

QTUMBTC 18.7 Update New SLNew Stop Loss on 0.001227
What are your positions? Share with us in a comment!

QTUM 7/16 Prediction
4 hour chart should be looked at also
RSI divergence shown on daily chart
Waiting for price to cross the resistance, also marked on the daily chart
MACD bounce on daily chart
Waiting on RSI 50 point cross

QTUMBTC 16.7 Update New SLNew Stop Loss on 0.001324
What are your positions? Share with us in a comment!

QTUMBTC 10.07 Update New SLNew Stop Loss on 0.001391
What are your positions? Share with us in a comment!


A good pick to outperform BTCQTUM seems to be in a good position to perform to the upside short term. If we do see BTC go to 6550 before going down, I think QTUM will probably jump around the .0017 area and then will establish a higher low while BTC will establish a lower low.
We need to see confirmation with BTC, obviously this market is not in a friendly trade environement but there is opportunities.
