QTUM accumulation in asc. triangle [potential 75%; RTR 3.95]TA:
>Price consolidation on rising OBV into ascending triangle (likely bullish breakout)
>Accumulation volume seen on volume profile
>Fib resistances as charted
FA:
>TLDR one liner: strong China POS platform coin relatively newer than NEO
QTUMBTC trade ideas

QTUMBTC 4H LongBullish market structure with higher highs being formed. Price has bounced from a deep bullish fib zone (between 61.8% and 78% levels), which lines up with the 34 EMA and roughly a previous resistance zone that should now act as support.

You can still Buy in the zoneClear path to the top, nice RSI and MAcd levels.
Green : Target 1
Blue lines; Buy Zone
Red: Stop Loss
Purple: Big motherfucking support if you are unlucky and miss the SL

QtumBtc TA roadmapTA:
-Completion of 1st wave diagonal due to the indicator to aline my top with divergent spot
-Retracement at golden 61.8 structure hold well and lot of wick below
-obv broke resistant good sign for strong volume
FA:
-QTUM X86 on the way!
TP:
-Shown in chart, need more data to identify the wave
Conclusion:
-Trader: I will hold the 3rd subwave wave completion and took 50% profit
-Investor: Hold till potential previous high as complete 1st implusive wave completion.
-If you follow my previous post I had an entry level and one of my heaviest bag in my portfolio.
TRADE with RISK MANAGEMENT!!!
I am an individual trader, based on personal analysis.
Welcome to share your ideas and let's improve it!
Follow and share if you like my work.
Looking for accountability partner in the trading journey and grow as professional trader

Qtum (QTUMBTC) by Popular Demand (219% Earnings Potential)You want to trade Qtum (QTUM)? I am sharing this just because you asked for it... I hope you enjoy it and make good money with it.
Qtum is one of the strongest altcoins in this market, if you look at its market cap. In a nutshell, the project is based on a mix of Bitcoin (BTC) and Etherum (ETH), think about that for a minute... Ok, done thinking? So... now... Let's trade!
***** Qtum (QTUMBTC) Trade Analysis by Alan Masters *****
TRADE INSTRUCTIONS
Buy-in: 0.00200 - 0.00238
Targets:
(1) 0.00254
(2) 0.00319
(3) 0.00364
(4) 0.00424
(5) 0.00589
Stop-loss: 0.00184
Trade strategy: (Basic) Buy, hold and sell on target. The stop loss is always optional, it depends on your trading strategies and goals. Long term holder don't need it, while shorter term traders can make use of it. It is up to you. I haven't been using one since March.
VERY ENTERTAINING
Let me entertain you a little bit.
How can I entertain you right now and for how long?
Will I succeed or will you know?
Are you being entertained yet?
Don't worry ... I am not here for your entertainment, I am here for you to get paid!
Namaste.

QTUM Long term targetsExpect some resistance above at pink line.
Long term targets.
Looking to trade in and out with target prices as sell points along the way.


QTUM LongThis has spent considerable time in this accumulation area highlighted. Look at the volume levels which we're seeing over the last week. This will pop soon.

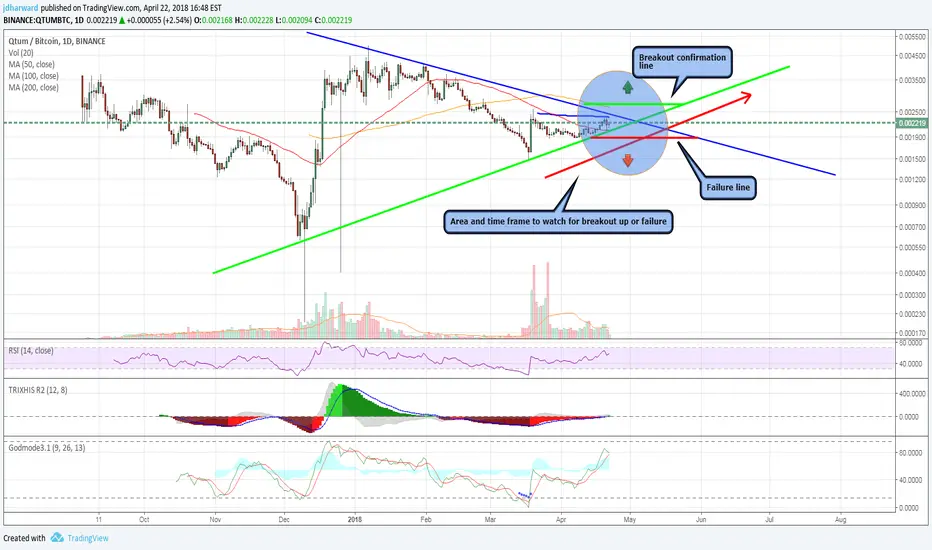
QTUM approaching breakout (or failure) pointQTUM, based on the daily chart, we can see we're nearing the end of a consolidation triangle.
The longer trend line suggest we're going to see a breakout, likely within the next 72 hours.
Breakout or failure will largely depend on the success or failure of Bitcoin to push beyond $9K and our $10-11K target before retreating.


QTUM FlaggingQuick look at $QTUM
1. Forming a nice bull flag (pink)
2. Hidden bullish divergences on multiple time frames.
3. MACD bullish crossover on the 4 hour.
4. Symmetrical Triangle also playing out.
Finding heavy resistance at the 200 EMA on the daily.

QTUM Short and Long Term TargetsQTUM Looks Good for Long Term Holds,
Which is There in Cloud, Hence Short Term Target would be 25 and Long Term i have traced in Chart

Qtum ready to test the waters Again!!Qtum has been testing the down resistance over the last weeks. Currently, the resistance is formed by the down and 200MA on daily. It's worth paying attention here. For an entry on break-out and touch of resistance- support by then:). Or wait for a pullback to the edge of the circle @ 21k sats level. I'll keep updating along the way.

QTUM/BTC [SHORT - MEDIUM] | BUY for %7+ PROFITOur indicators give buy signal!
Entrance : 0.00219650 - 0.00221869
Profit Points : 4% - 7% - More
Stoploss (Optional) : 2104
Stay tuned! Follow us for more signals.
Disclaimer: This is not a trade advice, every trade is at your own risk.


QTUM - Time to Buy - 100% Profit Potential!!!Hello everyone and thanks for viewing.
Let's get right to it!
QTUM broke out on March 19th and has yet to rally past its' month high.
Accumulating for a month now, QTUM won't be left behind next alt run.
My trading strategy on Binance
Buy up to 0.0022
Target 1: 0.00263 20% profit
Target 2: 0.00329 50% profit
Target 3: 0.0044 100% profit
Stop Loss 0.00187
Rating : 4/5 4 stars!!
Volume 1200 btc

QTUM-I've got my eye on youQtum is sitting on the 50 ma on the daily, sitting near the bottom of the ichi cloud, has falling sell volume and painted a very nice picture. You can see where the crowd on the side was waiting to buy the breakout of the falling triangle and the bears have pulled claws out. IF we hold the ichi cloud support I expect a nice bounce and uptrend resuming here.
Comment which direction you think it will move and why?

QTUMSome may see this as a cup and handle that so many coins are showing right now (since 21st March). However the volume profile doesn't match as well as I'd like... the volume was very strong pushing up to the left hand side with a lot of sellers falling out as the price then fell to the bottom of the 'cup'. However the volume pushing up into the right hand side is weaker in comparison and it may not (yet) have the strength to complete the pattern to the target (potentially at 38.2% fib 3160).
For the short-term - with the RSI overbought and regular divergence on the 4 hour and also on the MFI, plus bearish hidden divergence on the 1 day RSI (although this is lower than I would prefer for a hidden starting just over 50), I would normally expect a retrace. However the 1 hour RSI already had a strong correction and is showing bullish hidden divergence which may allow the price to make another jump possibly to the 2500 mark at the 23.6% fib.
Mid to longer term - There was a lot of support earlier this year when the price was in the 30-40k region, however there were also frequently sell walls stopping the price from exceeding 40k. We certainly have the volume to support moving higher and likely many holders in that upper region ready to sell! In contrast there were few sellers in the zone between 2500 and perhaps 3150 so with a bit of an increase in volume I would expect a swift move up with demand exceeding supply through the area.


QTUM +30% SWING PLAY$QTUM has been ranging for awhile now, and is testing the upper resistance atm. BB/ketlner squeeze + strong RSI and momentum are hinting at a breakout soon. R:R is nice in this spot as 0.328 fib has held 6/8 times. Target is the 1.272 fib and Ichimoku cloud flat ceiling.

Qtum Bullish TA RoadmapAfter reanalysis and count wave, I come to conclusion is going to bullish soon
-61.8% retracement recent swing
-1:1 range breakout hit target to bottom
-Volume increasing and indicator bullish sign.
I will load a bag to stack and long hold, one of my favorite project regarding FA view.
TRADE with RISK MANAGEMENT!!!
I am an individual trader, based on personal analysis.
Welcome to share your ideas and let's improve it!
Looking for accountability partner in the trading journey and grow as professional trader.

Placed three positions VEN/BTC, ADX/BTC,QTUM/BTC - get some!Hello Fellas,
did this right one to get VEN, ADX and QTUM on my Madhatter trading list. Placed all my positions with a rebuy and sell target.
Let's see what today's market will bring.
Good luck trading,
bitcoin-089
