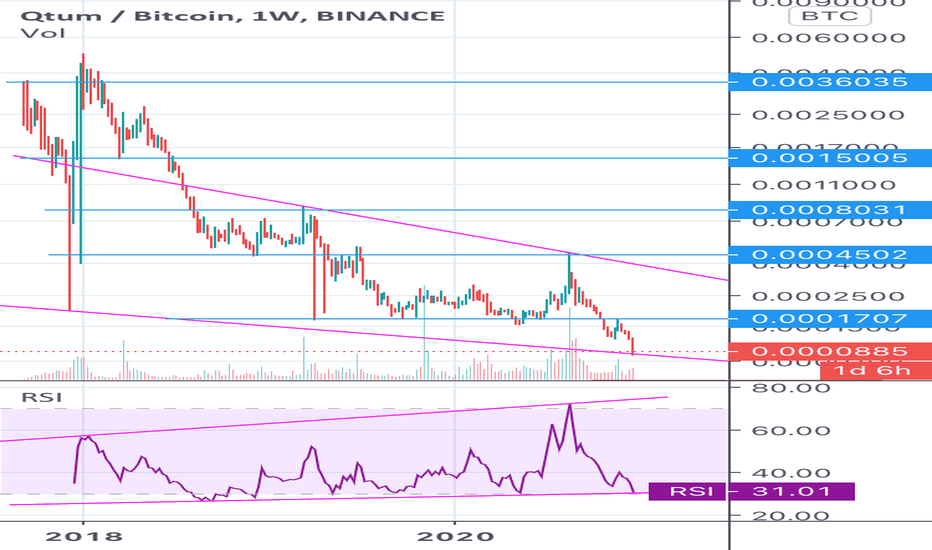
QTUM looks good from hereYOUR LIKE OR COMMENT IS MY FUEL FOR NEXT ANALYSIS :) IF U HAVE ANY QUESTION REACH ME HERE
This is not a financial advice. Always do your own research and always put stoploss in your trade (SL) :) If you want more detailed info how to study and read charts or just need help with some coin, just write to me here a comment, i will try to answer to everybody... i can help you :) all for free, don't worry, BE HAPPY!
If u like the analysis, please feel free to ask any question about this TA or crypto or any coin - leave a comment or like or share the idea, i really appreciate it because then my work makes sense :) thanks!
QTUMBTC trade ideas
LSL Slingshot SetupHere is a trade setup that has occurred many times recently.
The profit is not always this immediate, but it can still lead to some very nice entries in a bull market.
This setup is very specific, and requires many conditions to be met. Firstly, there is a markup in price. Then it moves sideways.
This encourages longs to enter, as the price is increasing, and there is support at and below the sideways movement.
Then, the price breaks out above the sideways movement. Any shorts will be likely to cover, fearing a breakout to the upside.
This creates buy pressure at this level. More longs will enter, creating more buy pressure.
However, the breakout fails. The breakout trader longs are left in the red, and the shorts get a little bit more aggressive.
The price spikes down, below where the first sideways moved was happening. This causes longs to get liquidated/stopped out,
creating more short term sell pressure. Maybe some shorts enter. The sell pressure lets up soon after the longs are stopped out
creating room for more buys again.
The price begins to get marked up. After all, the longs were liquidated, creating a fire sale. The shorts have covered by now
or are covering if they're smart, because they're in the green and the price is going back up. There is only buy pressure now.
Then, the price spikes up. It had nowhere else to go.
Before attempting to trade this setup, go back and look at many different charts and see it play out. You are responsible for your
own trading. Make sure that you know what you are doing and always manage your risk.
💡 Don't miss the great buy opportunity in QTUM/BTCTrading suggestion:
. There is a possibility of temporary retracement to suggested support line (0.00012). if so, traders can set orders based on Price Action and expect to reach short-term targets.
Technical analysis:
. QTUM/BTC is in a range bound and the beginning of uptrend is expected.
.The price is above the 21-Day WEMA which acts as a dynamic support.
. The RSI is at 70.
Take Profits:
TP1= @ 0.000165
TP2= @ 0.000211
TP3= @ 0.000256
TP4= @ 0.000303
TP5= @ 0.000360
TP6= @ 0.000450
SL= Break below S2
❤️ If you find this helpful and want more FREE forecasts in TradingView
. . . . . Please show your support back,
. . . . . . . . Hit the 👍 LIKE button,
. . . . . . . . . . . Drop some feedback below in the comment!
❤️ Your Support is very much 🙏 appreciated! ❤️
💎 Want us to help you become a better Forex trader ?
Now, It's your turn !
Be sure to leave a comment let us know how do you see this opportunity and forecast.
Trade well, ❤️
ForecastCity English Support Team ❤️
QTUMUSDT is inside a rangeAfter a nice profit In Vip Channel, $QTUM.X is inside a range and the price is testing 0.786 Fibonacci level. IF the price will have a breakout from the range and from descending 4h trendiline, According to Plancton's strategy (check our Academy), we can set a nice order
–––––
Follow the Shrimp 🦐
Keep in mind.
🟣 Purple structure -> Monthly structure.
🔴 Red structure -> Weekly structure.
🔵 Blue structure -> Daily structure.
🟡 Yellow structure -> 4h structure.
⚫️ Black structure -> <4h structure.
Here is the Plancton0618 technical analysis, please comment below if you have any question.
The ENTRY in the market will be taken only if the condition of the Plancton0618 strategy will trigger.
Qtum/BTC Cypher pattern Hi guys,
I want to share with you what i found out this week. It is perhaps not perfect for the olds men of finance.
But it is pretty much interesting as you can see the up trend since the cypher was formed.
Thank you for all your comments and a thumb will be appreciated. (it is my 1st publication)
💡Don't miss the great buy opportunity in QTUMBTCMidterm forecast:
While the price is above the support 0.00006278 , beginning of uptrend is expected.
We make sure when the resistance at 0.00015500 breaks.
If the support at 0.00006278 is broken, the short-term forecast -beginning of uptrend- will be invalid.
Technical analysis:
There is a divergence in RSI and price between the trough at 0.00012217 on 2020-11-06 and the trough at 0.00006340 on 2021-01-03, the probability of downtrend continuation is decreased and the probability of beginning of uptrend is increased.
The RSI downtrend #1 is broken, so the probability of beginning of uptrend is increased.
A trough is formed in daily chart at 0.00006278 on 01/03/2021, so more gains to resistance(s) 0.00013020 and maximum to Major Resistance (0.00015500) is expected.
Price is above WEMA21, if price drops more, this line can act as dynamic support against more losses.
Relative strength index (RSI) is 63.
Trading suggestion:
There is possibility of temporary retracement to suggested Buy Zone (0.00009435 to 0.00008161). We wait during the retracement, until the price tests the zone, whether approaching, touching or entering the zone.
We would set buy orders based on Daily-Trading-Opportunities and expect to reach short-term targets.
. Beginning of entry zone (0.00009435 )
. Ending of entry zone (0.00008161)
Take Profits:
TP1 @ 0.00013020
TP2 @ 0.00015500
TP3 @ 0.00021100
TP4 @ 0.00025700
TP5 @ 0.00030300
TP6 @ 0.00035310
TP7 @ 0.00043750
TP8 @ 0.00071895
TP9 @ 0.00119043
TP10 => Free
❤️ If you find this helpful and want more FREE forecasts in TradingView
. . . . . Please show your support back,
. . . . . . . . Hit the 👍 LIKE button,
. . . . . . . . . . Drop some feedback below in the comment!
❤️ Your Support is very much 🙏 appreciated! ❤️
💎 Want us to help you become a better Forex trader ?
Now, It's your turn !
Be sure to leave a comment let us know how you see this opportunity and forecast.
Trade well, ❤️
ForecastCity English Support Team ❤️