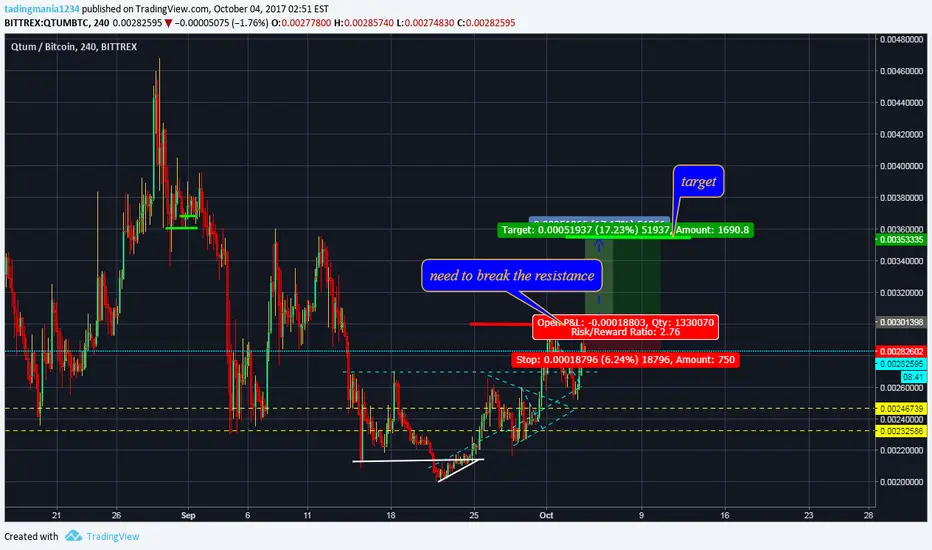
Watch QTUM in the next hourQTUM has the potential to continue it's uptrend. Keep an eye on breaking the triangle pattern over the next hour. If it breaks the upper resistance then it's a potentially good buy. Set your stop loss a bit below the bottom part of the triangle.
Target: 28000 - 28400 resistance levels or if it breaks that even 28800
Buy: 27700 - 27900
Stop: 27600 or a bit below
QTUMBTC trade ideas


QTUMBTC updatePosted my support (blue) and resistance (red) levels. Price is respecting the channel, next level would be 0.002900, then 0.0032400 .
Have your own sl please.

QTUM Trading OpportunityQTUM touched trend line and neck line . 1h and 4h Stochastic shows that next Movement must be up.
Buy 0.0025
Sell 0.003 - 0.0031
Dont forget that can sell in parts

Qtum: don't go long in a downtrend!Qtum has touched the bottem of a falling channel.. and is rising up again: in a pattern known has lower highs, lower lows, als known as a downtrend!
Will it rise further: not unlikely. Should you go long? I wouldn't!
Plenty of more attractive coins out there that are in fact in a uptrend.
If you would check RSI on the 4 hrs pricecandles you will see (from the bottem of the downward channel as shown on the daily candles in the above graph) there are higher peaks in price with lower peaks in RSI.. also known as bearish divergence.. another warning not to go long here!


Bears vs BullsNow we have the bearish triangle, but in other hand QTUM looks very strong (token swap from ERC20 to Ignition proceeds today), so bulls could be stronger. Watch for a confirmation.

Qtum/btc my first test TAi is only test
i buy some qtum at 274 :) according to my TA i shoud sell it and rebuy at 240 but i will not sell i will hold them until it go to 350
i try to look at resistance line and support line
MAcd show go down
RSi there are big sells
if you have good experience give me your notes
this TA is not for trading it is for learning

QTUMBTC updateQTUMBTC made a good progress from support level, and perform channel up with 30% profit target from this position to 0.0035239
If this coin break down channel up, Support level at 0.00217783

QTUM-BTC - Living on the "Edge"QTUM is currently forming a falling wedge against BTC on a daily chart. Also, MA support and Fib are favoring the long position.
Buy at current levels, with room to average till 0.00255.
Targeting 0.003550 level.
Stoploss can be placed around 0.00249.
Goodluck :)


Short on QTUM during bullish runQTUM is in a bullish run, SMA50 breaking downward trend and a second bullish pennant (bull flag) may form. With the second bull flag an opportunity rises to short QTUM on a one/two day time frame with 4-9%.
If bull flag doesn't hold and breaks downwards you still have expanded your absolute position in QTU M. If QTUM breaks upward from the pennant, enjoy the ride and take your double profits.

Just on timeQTUM is now on bottom line, the price still increment??
buy now and let the price follow the bottom line

