QTUM/DOLLAR 2H DARVA BOX STRATEGYStep #1: Identify at least two Darvas boxes that are on top of each other
The first trading rule is to let the market develop at least two Darvas Boxes. Basically, the two Darvas boxes are showing that the market is starting to move in steps to the downside. So at this point, the market also should be making lower highs followed by lower lows, which is the basic definition of an downtrend.
In the real world, you’ll notice that the Darvas boxes don’t perfectly stack on top of each other. You’ll rarely find a series of Darvas boxes where the following box has the bottom perfectly aligned with the top/bottom of the previous box.
You will notice that the price range of the second Darvas box can move into the space of the first Darvas box which still qualify for a valid Darvas box.
Note* Big candle wicks are ignored when drawing the Darvas box. Use the closing price instead.
Step #2: Draw a support line in the middle of the first Darvas box
We’ve noted that there is no such thing as perfection when dealing with the price action. And since the Darvas boxes tend to overlap, another characteristic is that in most of the cases the top/bottom of the current box won’t exceed the middle of the previous Darvas box.
In this case, we can anticipate that the third Darvas box will develop its top around the middle or bottom of the second Darvas box.
Step #3: How to sell QTUM: Sell when we test the middle or bottom of the 2nd Darvas Box
We want to buy low and sell high because that’s the rule number one to make consistent profits.
We sell QTUM as soon as the middle or bottom of the 2nd Darvas box is tested this will ensure that we sell on a retracement in an already proven downtrend.
Step #4: Place your protective Stop Loss above resistance level in the second Darvas Box
Our improved cryptocurrency sell strategy comes with the advantage of providing us with a very tight stop loss. We can hide our protective stop loss within or above the second Darvas box.
A break above the second Darvas box will invalidate the whole price structure and it’s wise to get out of the trade as soon as possible.
Two things can measure the success of a trading strategy.
First, how tight the stop loss is and secondly the stop loss placement needs to be logical not just a random price coming out from over-optimization.
Step #5: Take profit needs to be 2 or 3 times more than your stop loss
Opening a trade is just the beginning; you also need an exit strategy to maximize your profits. It’s often said that it’s more important where you take profits than your entry strategy
The professional traders place more weight and attention on the exit strategy because that’s how they make money. Probably, this is one of the oldest trading secrets that smart money doesn’t want you to know.
Note** the above was an example of a SELL trade using the Free QTUM cryptocurrency strategy. Use the same rules for a BUY trade – but in reverse.
QTUMUSD trade ideas

QTUM - About time! We have been noticing BINANCE:QTUMUSD since quite a while now. Volume/Market Cap ratio generally stays above 40%, with divergence on the daily chart showing accumulation within the current price range.
Trade Plan:
Buy zone: $7.30-$7.10
Stop loss: Closing based stop below $6.74
Target: $11.20 - $12.40

QTUMUSD COMMENTSThe bars are close to the lower band but have not yet had contact which shows there could be a further bullish movement in the market and not bearish, the RSI also agrees with that analysis as the lower band only just retracted price. The EMAs show a downtrend in price but I would rather agree with the BB and RSI. Both Resistance and Support Line conform with the Fib, so Target Price is place just closely to Resistance and Stop Loss just below Support.

Goals of QTUM for the end of the year +2800% A trend analysis shows that the next growth will be protracted and steep, so the goals are quite realistic


My take on QTMUSD / QTUMUSDQuantum has existed the down trend channel, now it's heading up to at least 12.9 USD. If things going well (meaning BTC can climb back to 12k), the best shot in short term is 30+ USD.

QTUM/USD June's Lows Almost ReachedQtum has broken through the support area at $8.2628 on Tuesday and developed its decline later. The currency pair has lost more than one percent in the past 24 hours. There is no clear direction currently as the price is close to June’s lows and we think bulls have prepared a huge support there.
The currency pair fluctuates close to the support area at $7.4706 in the moment of writing. This level is important is June’s lows lie there. We do not think that bears will be able to jump over it without any troubles.
As for the scenarios for the nearest future, QTUM is able to reach the support area at $7.4706. This is the main scenario for Thursday. However, bulls are able to regain momentum and drive QTUM/USD higher. The targets are above $8.2628.
Check the full crypto analysis HERE>>> .

QTUM/USD At CrossroadsQTUM follows the other cryptos and feels bad on Tuesday, but we think that the currency pair still looks promising and is able to change the tendency in the nearest future. The currency pair has lost more than six percent in the past 24 hours.
QTUM tested the resistance area at $9.23 on weekend but bears were stronger than bulls and prevented them from progressing higher. However, the price stopped at $8.26 currently. QTUM has reached the ascending trend line.
As for the possible ways, we think that QTUM is bullish and the currency pair is going to resume its uptrend line the nearest future. QTUM/USD is going to reach the closest resistance area at $9.23 at least. IF bulls successfully test it, the currency pair will progress higher.
Bears seem to unable to push it lower, but if they have enough power, they will run the currency pair towards the next support area at $7.47.
Check the full crypto analysis HERE>>> .


qtum ready to movehd pattern with falling wedge & bullish div on macd-mom-rsi-stoch
this can give us good chance to get a high profit.

qtumusdu can buy here and try but always sell if it drop under 8.80 usd
no confirmation yet but possible bottom
Ernst and Young partners with Microsoft - BCH AI/ML SignalFinancial firm Ernst and Young has partnered with Microsoft to advance the content rights and royalties’ management process using blockchain technology. The two firms are looking to create a solution where intellectual property will be licensed, and the creators will be paid royalties. The blockchain solution will develop a value chain catering to authors, production houses, songwriters, and developers. The blockchain network will be developed using the Quorum blockchain protocol along with Microsoft’s Azure cloud infrastructure.
The AI Machine Learning 3-Day Crypto Signal for Bitcoin Cash is Buy and was published this morning. Learn how to use ML 3-Day signals when trading cryptos. The average accuracy score for the Machine Learning algorithms for Bitcoin Cash is 64.73%

Qtum Bottom in? June 2018So I was looking over charts today and came across QTUM. Looking at the over all thing it looks like the bottom is in. I think I will be playing this on Bitfinex. See on there you can hold BTC & USD and you can hold alts too. Now with the alts you hold you can put them in your margin account and use that USD value to play some coins on margin. I think holding QTUM and using it as my USD I have a chance to make extra interest if that makes sense. Then sell this for either $ or BTC in a few weeks when hopefully it has risen by 40% or so.
Everything looks good I think getting in here is getting in at the bottom. Worst case is I lose 10% which can happen in an hour when holding BTC.
Idea view on 1hr timeframe.
Zoomed Out
Vs BTC

QTUM - At support $10 - New ATH target of $150 (LT trade)Hi all,
QTUM USD caught our intention due to its sane corrective behavior on top of strong fundamentals on the technology side.
Assumptions:
- Finalizing correction phase
- Doube bottom formation
- RSI at bottom, compressed in the apex of a falling wedge
- Great R/R ratio
Stop Loss: $8
SL to be readjusted to break even after 1st is achieved and so on.
Target profits:
TP 1 --> $28
TP 2 --> $68
TP 3 --> $155
This forecast is not a financial advice, study, exercise yourself, put into question your reasoning.
Well, strive to be a better trader tomorrow than we are today.
All the Best from the Crypto Space
Alteroc
AI Trader assistant, includes Bitmex (15% discount) --> app.aitrader.ai
twitter.com

Quantum huge descending wedge + Triple bottomI have not seen a better alt-coin chart than QTUM's.
This is probably the epitome of the perfect chart to go long.
A huge descending wedge, the bottom of which is supported by the previous high volume nodes forming a triple bottom!
HOWEVER, it looks like Bitcoin is about to go to Goblin town any time soon, and in this kind of market environment, alt coins' individual charts don't mean shiet.
It's a pity..


qtumusddowntrend channel buy zones are Specified.
PLEASE ATTENTION!!! : important notice: this is a test chart And it has no other value dont use it but if you have any ideas about it please tell your comment thank you regards

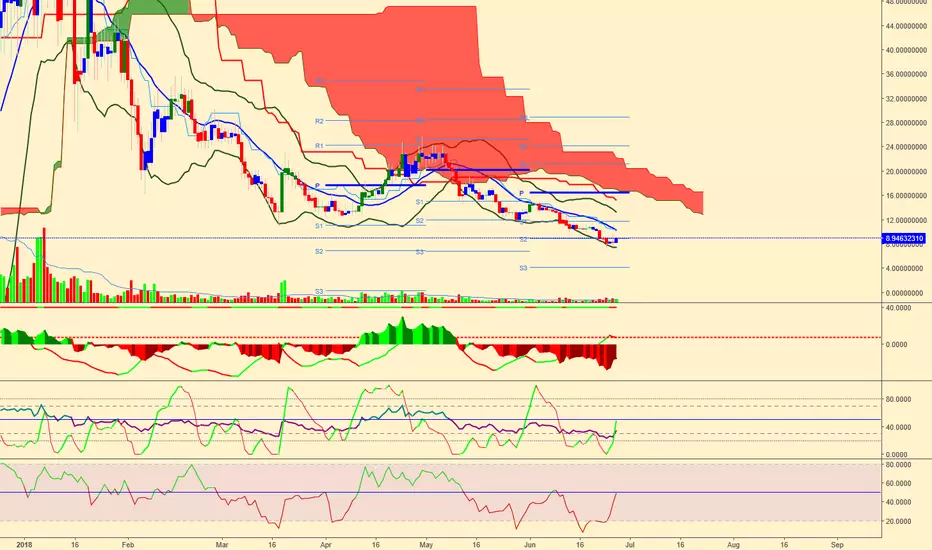
QTUM can push a little more.QTUM has lost -2.49% in the last 24H and keeps trying to get away from the minimums of the beginning of the week, the price has bounced in S2 and the buyer impulse seems strong to push it a little more upwards to look for R1 close to $ 13.87 .

QTUM going onto Wave 3
Assumption: The day 1 price drop, I'm ignoring that. Qtum doesn't have enough data. Maybe more data there is, the wave counts will change too.
Qtum just finished a Extended Wave 2 flat. Lets see where this goes

Qtum and it's trading channelsWe are currently in the purple tradingchannel. However, we could easily promote to the Orange trading channel. And if everything goes well. We have the blue big trading channel for the long term.


Qtum Machine Learning AI Crypto SignalThe rolling three-day signal for Qtum (QTUM) is "Don't Own". This is day one of the three-day signal. The signal will be updated again Friday. For further details or discussion, feel free to leave any questions or check out signature/profile.

QTUM update, One more dip to go????As it is not able to break previous high on price as well as on RSI(RSI have rejected again on 30 min chart)There might be a possibility to drop around 13.80, where 14 level may become the emotional support.
