QTUM/USDT Weekly Update!Hello everyone, I’m Cryptorphic.
For the past seven years, I’ve been sharing insightful charts and analysis.
Follow me for:
~ Unbiased analyses on trending altcoins.
~ Identifying altcoins with 10x-50x potential.
~ Futures trade setups.
~ Daily updates on Bitcoin and Ethereum.
~ High time frame (HTF) market bottom and top calls.
~ Short-term market movements.
~ Charts supported by critical fundamentals.
Now, let’s dive into this chart analysis:
QTUM is holding the supporting trendline at $2.5. This is a crucial juncture for QTUM to determine whether it will continue the downtrend or make a rebound from the current support level.
Key Observations:
~ Primary Support: $2.5.
~ Lower Support: $1.11.
~ Primary Resistance: 50 SMA at $3.15.
~ Long-term Target: $27-$30.
~ Bearish Move: Breakdown below the primary support.
~ Bullish Move: Price holding the primary support and rebounding above the 50 SMA.
The price speculation is in a higher time frame and for educational purposes only. Please do not consider it for scalp trading and futures trading.
DYOR. NFA.
Please hit the like button to support my content and share your thoughts in the comment section. Feel free to request any chart analysis you’d like to see!
Thank you!
#PEACE
QTUMUSDT trade ideas

QTUM buy/long setupFrom where we placed the red arrow on the chart, it seems that the correction of QTUM has started.
This correction looks like a triangle or diametric as we are now at the end of wave E.
The targets are clear on the chart.
Closing a daily candle below the invalidation level will violate the analysis.
For risk management, please don't forget stop loss and capital management
When we reach the first target, save some profit and then change the stop to entry
Comment if you have any questions
Thank You

QTUM/USDT.PSymbol: #QTUMUSDT.P
Market: FUTURES
Position: LONG
Leverage: Isolated 5x
Entry Targets:
✅1) 3.394
✅2) 3.281
Take-Profit Targets:
🎯1) 3.446
🎯2) 3.503
🎯3) 3.573
🎯4) 3.644
🎯5) 3.746
⛔️Stop Loss: 3.222
Black: Entry Targets
Green: Take Profit Targets
Red: Stop Loss
WinTap VIP Trading

#QTUM/USDT#QTUM
The price is moving in a bearish channel on the 4-hour frame and sticking to it well
The price rebounded well from the lower border of the triangle at the green support level of 3.80
We have a tendency to stabilize above the Moving Average 100
We are oversold on the RSI indicator and we have a downtrend that is expected to break higher to support the rise
Entry price is 4.00
The first goal is 4.40
Second goal 4.68
The third goal is 5.00

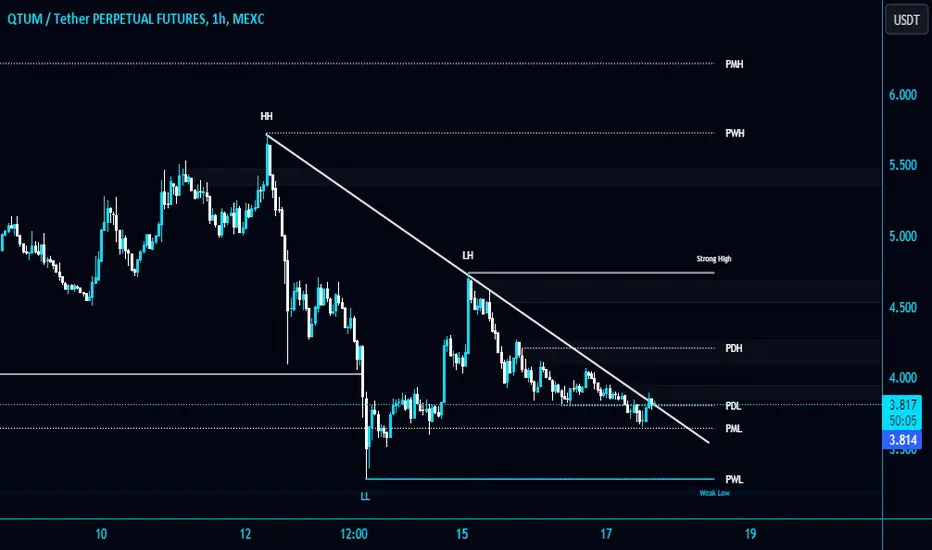
#QTUM/USDT is trying to break the Diagonal Trendline in 1-hour T#QTUM/USDT is trying to break the Diagonal Trendline in 1-hour TF!
So far, no luck. AMEX:QTUM needs to clear the Trendline to gain bullish momentum. Wait for BO & retest to open a long position.
#QTUM is holding PML $3.65 as a strong support. The next support level is PWL $3.29.
QTUM LONG SETUP ALL trading ideas have entry point + stop loss + take profit + Risk level.
hello Traders, here is the full analysis for this pair, let me know in the comment section below if you have any questions, the entry will be taken only if all rules of the strategies will be satisfied. I suggest you keep this pair on your watchlist and see if the rules of your strategy are satisfied. Please also refer to the Important Risk Notice linked below.
Disclaimer

QTUM looks a rocket !QTUM seems to have entered a bullish diametric for some time now.
Now it seems to be inside wave D of this diametric.
The green range is a suitable place for buy/long positions.
The targets are marked on the chart.
Closing a daily candle below the invalidation level will violate the analysis
For risk management, please don't forget stop loss and capital management
When we reach the first target, save some profit and then change the stop to entry
Comment if you have any questions
Thank You

QTUM SET FOR BULLISH RALLYQTUM is currently trading in downtrend due to rise in BTC Dominance and is currently going towards demand zone. Breakout from a descending channel can be signal towards bullish rally and resistance zone.

QTUM/USDT A Bullish Journey from a Pivotal Demand Level👀🚀💎 Paradisers, buckle up for an enthralling ride with #QTUMUSDT as it plans a bullish journey from a critical demand level at $3.756. This level hints at a robust leap into bullish territory.
💎 A standout feature is its escape from a descending trendline, propelling #QTUM on an optimistic trajectory. This shift marks the resurgence of bullish momentum, favoring an upward surge. If this energy persists, our next target lies at the $6.097 resistance zone.
💎 However, let’s stay vigilant. Should AMEX:QTUM face obstacles and struggle to maintain its stride, a bullish effort from the $3.174 demand level could come into play. But beware—a descent below this threshold may prompt the asset to revisit the trendline it recently overcame, signaling a critical juncture for its short-term direction

QTUM - Very clear!Dear my friends,
QTUM has broken the downtrend and is recharging. Price is above the support zone. A cumulative set of candles with a series of wicks. The possibility of an explosion in the last days of the year is very strong. Looking at the monthly frame, this is even more evident when observing RSI.
Not much to wonder about here. So I placed an order and waited. 3 goals as shown on the chart.
Best Regards,

QTUM macroeven thought alt coins have pumped a lot, the rally is not over, some alt coins haven't even started
I believe most alt coins will do at least a 10x from their CMP (march 2024)
this is QTUM and the chart looks bullish to me
but you should never follow blindly,
have your own analysis too
educational purpose only
nfa

Altcoin Boom and QTUMUSDT 150% PotentialQTUMUSDT has broken above the uptrend trendline resistance, a significant milestone in its price action journey. Following this breakout, we observed a subsequent breach of the previously established high at $4.27. While the current pullback may appear as a temporary setback, it actually presents a compelling long-term buying opportunity not only for QTUMUSDT but also for most altcoins.
This pullback could mark the onset of the strongest upside wave for alts, with the potential for approximately 150% price increase in the coming months. For QTUM, our upside target is set at $10.6, aligning with the 361.8% Fibonacci retracement level.
Be prepared for what could be an extended altcoin season, offering opportunities for both short-term and long-term positions.

#QTUMUSDT#QTUM
The price has been moving in a descending triangle since July 2023
The downtrend was breached
And the Moving Average 100 exceeded
Current price 3.70
First goal 4.395
Second goal 5.320

QTUM/USDT Need to bounce from the support for back to upward!💎 QTUM has recently encountered notable market dynamics, currently resting on a support area.
💎 If QTUM demonstrates a positive sign such as a bullish candle rejection at this support, there is probability for a bounce upward, leading to a retest of the strong resistance area.
💎 However, if QTUM fails to bounce at this support level, it could be a concerning sign. A breakdown below the support level may lead to further downward movement, with the next potential stop being the demand area around 3.134.
💎 QTUM must bounce from the demand area and reclaim the area above the support to sustain upward momentum. Failure to do so could result in continued downward pressure on QTUM's price.

QTUMUSDT 3D#QTUM 300% bullish rally is coming. Volume has increased well. Price is testing the horizontal resistance several times. Golden Cross has happened on the 3-day chart. Targets are:
$7.466
$9.205
$10.943
$13.419
$16.572


QTUM ANALYSIS (6H TF)We have a large diametric, which seems to be in its final wave, its G wave.
It is possible that the g wave will be shortened due to buying pressure. A strong support area has been established, and the price can move from this area to high TPs.
For risk management, please don't forget stop loss and capital management
When we reach the first target, save some profit and then change the stop to entry
Comment if you have any questions
Thank You

QTUM ANALYSIS🔮 #QTUM Analysis —— BREAKOUT 🚀
💲💲 #QTUM was trading in a Symmetrical Triangle, and breakout has already confirmed and also the breakout of major resistance zone, expecting bullish rally towards $8.946 and more💰 In Coming Days ✍️ ✅
📊Current Price -- $5.831
🎯Target Price -- $8.946
⁉️ What to do?
- We have marked crucial levels in the chart . We can trade according to the chart and make some profits. 🚀💸
#QTUM #Cryptocurrency #Breakout #DYOR

QTUM: Unlocking Opportunities in the Blockchain Landscape? QTUM's breakout demands careful consideration, signaling a clear statement for market participants to take note of.
It's essential to keep an eye on QTUM and monitor chain analysis data. Despite short-term optimism, staying vigilant and analyzing blockchain data can provide valuable insights into its performance and potential trends.
Please feel free to comment. Thank you. Of course, this is not investment advice :)

$qtumusdt trading ideahello guys
im looking for a pull back to enter position. I will wait patiently, cause 65% profit may come.
entry and Tp prices on the chart

QTUM Buy CallHi All
Qtum is at very exciting levels, making 2 double bottom and one triple bottom pattern.
1. Green color path is showing double bottom at level 1.76 and now broke neckline at 4.34 once and waiting for reconfirmation, if it breaks this level again we should look for target 1 and 2
2.Pink color path showing double bottom at same level with neck line at 3.57, it already broke this level with confirmation.
3. At the same time it also making triple bottom formation.
based on all above indicators and patter , we can take a long call on this and expect target 1 and 2 in coming months.

QTUMUSDTThe monthly descending triangle formation for QTUM has been broken. Upon weekly closures above $4.25, it will sequentially target $19,21, and $35. The most negative scenario is insufficient volume. As the price increases, the volume will rise.

QTUM USDTAMEX:QTUM is looking good in a Weekly chart and is showing positive signs. It is consolidating approx from 623 days. After flipping the zone in blue at 3.845 It will be a good time for an entry. If a daily or 4-hour candle is closed above the level, you can take an entry on this.
All the information you need is right there on the chart. It’s important to set a stop-loss, which is like a safety net to limit potential losses in case the market
