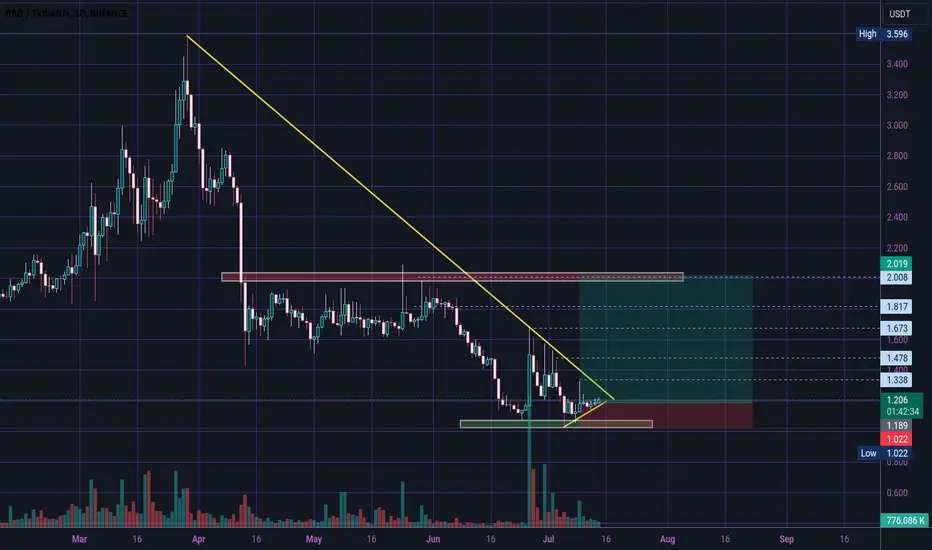
RAD IN DAILY TIME FRAME Hi dear traders
The price in the daily time frame has formed a double bottom pattern.
We expect to reach the desired goals by breaking the bearish trend line.
Let's see what happens
This is not financial advice ( DYOR )
Good luck 👍
RADUSDT trade ideas
RAD is ranging between the support and resistance level.RAD is ranging between the support and resistance level. The support is $1.079-$1.197 area and the resistance is $2.084-$2.137 area. You can trade in this range with proper stop loss.

Radworks (RAD) - To the moonOn he above 4-day chart price action has corrected 95% since $30 in 2021. A number of reasons now exist to be long, including:
1) Price action and RSI resistance breakouts.
2) Price action confirms the 21-week EMA (Green line), now a bull market.
3) Support and resistance. Look left (black arrows). Price action confirms support on past resistance.
4) The falling wedge breakout confirmation may now be used to forecast the market top for this alt.token at 1400% from the lows. That’s just shy of $30.
5) This idea is remarkably similar to the idea on FIDA that was recently published before printing a 90% move inside 15 days. See below.
Is it possible price action corrects further? Sure.
Is it probable? No.
Ww
Type: trade
Risk: <=6%
Timeframe for long:
You know how many messages I received asking if FIDA would come back down to fill long orders? The market is now considerably oversold. Don't be one of those folks!
Return: 1200% from current levels
FIDA idea for comparison.

RAD/USDT Falling Wedge Pattern Indicates Potential UpsideBINANCE:RADUSDT
The chart shows a technical analysis for the cryptocurrency RAD/USDT on a 3-day timeframe using Heikin Ashi candles. The chart highlights a falling wedge pattern with a possible target of 3.75 USDT.
Here's a brief analysis based on the chart:
1. **Falling Wedge Pattern**: This is a bullish reversal pattern that indicates a potential price increase once the pattern is completed. The pattern is formed by converging trend lines that slope downwards. In this case, the pattern has been highlighted and is likely signaling a potential breakout to the upside.
2. **Possible Target**: The chart indicates a possible target of 3.75 USDT. This is often derived from the height of the back of the wedge added to the breakout point.
3. **Current Price**: The current price of RAD/USDT is shown as 1.470 USDT.
4. **Breakout Confirmation**: For the pattern to be confirmed, a breakout above the upper trend line of the wedge with substantial volume is needed.
Potential Trading Strategy
1. **Entry Point**: Consider entering a long position once the price breaks above the upper trend line of the falling wedge with strong volume.
2. **Stop-Loss**: Place a stop-loss below the lower trend line of the wedge to protect against false breakouts.
3. **Profit Target**: Aim for the target price of 3.75 USDT, as suggested by the chart.
Risk Management
- Ensure proper risk management strategies are in place, such as not risking more than a small percentage of your trading capital on a single trade.
- Keep an eye on overall market conditions, as broader market trends can impact the performance of individual cryptocurrencies.
Technical Indicators
- Consider using additional technical indicators like the Relative Strength Index (RSI), Moving Average Convergence Divergence (MACD), or volume analysis to further confirm the breakout and potential price movement.
Always perform your own research and consider consulting with a financial advisor before making any trading decisions.


#RAD/USDT#RAD
We have a bearish channel pattern on a 4-hour frame, the price moves within it, adheres to its limits well, and is expected to break it upwards in a strong manner.
We have a support area at the lower border of the channel at $1.60 from which the price rebounded
We have a tendency to stabilize above moving average 100
We have an uptrend on the RSI indicator that is about to break higher, supporting the price higher
Entry price is 1.80
First goal 2.12
The second goal is 2.29
The third goal is 2.51

The $RAD pump to $3 is just a matter of time!Hi.
BINANCE:RADUSDT FRGXUSDT
Chart is Speaking It Self!!!
Simple analysis...
Stay awesome my friends.
_ _ _ _ _ _ _ _ _ _ _ _ _ _ _ _ _ _ _ _ _ _ _ _ _ _ _ _ _ _ _ _ _
✅Thank you, and for more ideas, hit ❤️Like❤️ and 🌟Follow🌟!
⚠️Things can change...
The markets are always changing and even with all these signals, the market changes tend to be strong and fast!!

Long Trade Position RADUSDTRaise your analytical skills with the targets that I will give you and test your patience and strategy to reach price targets in the demo panel with virtual money. These exercises make you experience profit and loss with targets and stops, virtually in the real market and improve your analysis and personal strategy. Know your fear and greed and gradually control them so that your business is profitable and less harmful. I wish you happiness and wealth

RAD will be huge after accumulationRAD will be huge after longterm accumulation - trading spot and bot (grid-bot)

RADUSDT | RADBTC | Radworks - Trading ideaRADUSDT | RADBTC | Radworks - Trading idea
Buyer are there in longer time frames ( B0-B1-B2 )
xd-Band - Breakout

RAD Growth Spurt: Buy Your Ticket to Profit!Radworks (RAD) Coin: Quick Summary
What is it?
RAD is the Ethereum token that powers the Radworks ecosystem, a community-driven organization focused on funding and developing new, permissionless technologies that promote internet freedom.
Recent News
RAD price has increased 33% in the last 7 days, outperforming the overall crypto market. (CoinGecko: www.coingecko.com)
Trading volume has decreased significantly in the last 24 hours. (CoinGecko: www.coingecko.com)
Important Disclaimer
I am not a financial advisor and this is not financial advice. This information is for educational purposes only. Please do your own research before making any investment decisions.

#RAD/USDT - Long - Potential 53.35%Strategy: Long
Exchange: BINANCE
Account: Spot
Entry mode: Market order in range
Invest: Risk 1%
Exit:
• ⎿ Target 2 : 4.806 53.06%
• ⎿ Target 1 : 3.591 14.36%
Entry: 3.140 ⌁ 3.140
• ⎿ Current market price: 3.129
Stop: 2.734 (-12.93%)
Technical indicators:
Break of 2901 resistance.
• ⎿ 24h Volume: 19432437.1221
• ⎿ Satoshis: 3.14
• ⎿ Analysis: TradingView

Rad/Usdt Plan The price of RAD/USDT is on the verge of a breakout, with expectations of a 30-60% bullish move upon a successful breakout. The current trend indicates a high probability of a bullish breakout. Please note that this information is not financial advice; do your research before making any financial decisions.

60 fib ABCD to the top or drop?This is a bounce off of the Daily 60 fib and used the ABCD pattern from the C-line . Very close SL just in case. Let's see what happens.

60 ABCD to the top or drop?This is a bounce off the 6 Fib and using the ABCD pattern. Let's see if we can go there.


#RADIn the D1 time, there is a correction in the specified resistance, which can retest the previous ceiling by maintaining the Fibo 50% of the $1.56 area, and in case of failure, continue the growth to the next area, which is the important weekly supply area. If it penetrates below 1.56, it will have a short-term daily downward trend.

$RAD*ASY Buy signal. Long 3x leverage
1HR:
Bullish trend strength: 19
MA7 > MA25 > MA99
Price > MA7
Chikou Span > Price
MACD > 0
1D:
Bullish trend strength: 22
ADX > 25
MA7 > MA25 > MA99
MA50 > MA100 > MA200
Supertrend is long
Price > MA7
Price > MA50
Chikou Span > Price
Bearish reversal potential: 6
Bearish Kumo Breakout
MACD Bearish Cross
3D:
Bullish trend strength: 17
ADX > 25
MA7 > MA25 > MA99
Supertrend is long
Price > MA7
Chikou Span > Price
Bearish reversal potential: 5
Bearish Engulfing

RADUSDT | Near Breakout @2.912RADUSDT is all ready to submit breakout on weekly timeframe at 2.912. It has the consolidation period of more than 2.5 years. A close above the breakout point will yeild 100 to 220% returns on weekly scale

RADICLE targets and signalRAD is trading at an important neckline-resistance level.
Lower time frames show many bullish signals.
More info in the pics bellow.
>Targets on-chart.
>Merry Christmas !

RAD Temp Pullback Due to BTC.D Due to ETF Hype the BTC D taking all liquidity in the market , after the approval Hype toke place the Money will flow back to ALTS
RAD was having 4H Downtrend in short term which has been broken today , DCA from here
Liquidity grab above 2 $ Area is a most now and then RAD will decide which position will take

RAD healthy Pullback to 1.7$ range & gearing up for 3$ area testamazing and expected behavior from RAD last couple of weeks
it keeps smashing and testing level with healthy pullback always to demand zones
RADworks have niece potential and gearing up for massive pump
take SPOT position now without SL and DCA from here ,
catch you later on 3 $ area

