Potential 8.6% gain in RAREUSDPotential 8.6% gain in RAREUSD pair for the following reasons:
Longer-term Chart (150min)
-As seen in the longer time frame (150min), we can see that the price of RARE is overextended to the downside (Using custom Data Distribution with Extreme Clusters indicator showing yellow dots and highlighted background)
-Custom indicator below (Zero-Lag USI) has changed background from red to black, meaning that there is a potential reversal in momentum coming.
-Technically, we can see that there is a slowdown in slope of the move, and the bars here are getting smaller with the tails at the bottom, showing strength to the upside.
Shorter-term Chart (30min)
-Custom Data Distribution with Extreme Clusters script is also showing oversold levels in agreement with the 150min chart, showing confluence.
-Custom Zero-Lag USI script is showing a green background (shown here by the green arrow), which means that the strength is already potentially shifting here. We hope that this potential change in momentum will eventually shift/spill over to a larger time frame. Thus, the USI on longer time frame should eventually also change from the black background to the green background, showing a gain in strength and potential reversal to the upside on the 150min chart.
RAREUSD trade ideas

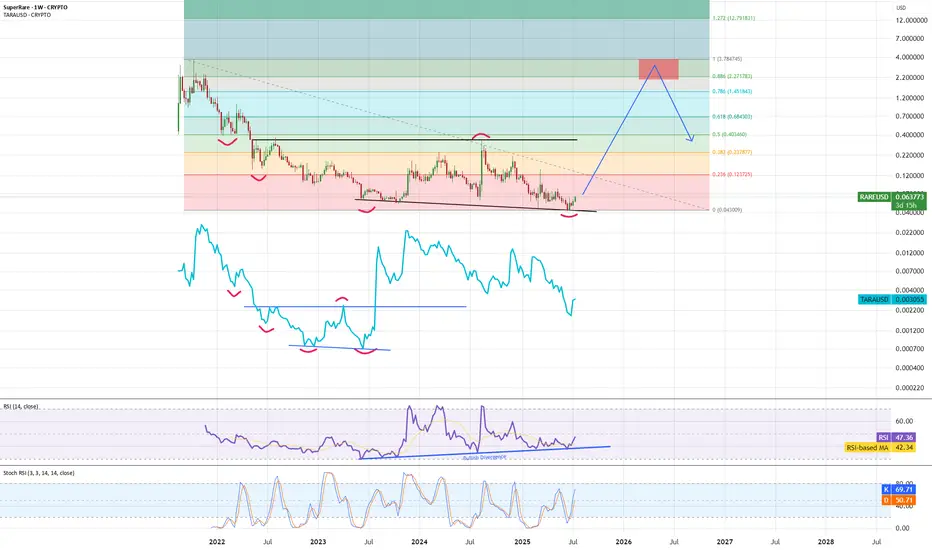
RARE - getting ready for push upRARE did double bottom correction, developed bullish divergence and has pattern similar to TARA before it reversed.
Expecting bounce and strong push up to test fibb 0.886 range, possible wick of ATH, followed by bigger correction.
RARE - ready for blast off?Weekly TF
Finding support @ 0.056
Increased strength on RSI
Huge upside potential @ 5,800% to ATH
187:1 reward vs Risk

$RARE opportunity to make 63% in under a weekI'm seeing a lot of charts like this lately, and right now this one's trading at about $.11 and headed for at least $.18 which would be a quick 63% and if it follows suit with every other chart in this family of patterns that is popping off this week, it'll get up there in under another week. And that's a conservative selling price, it's likely to go much higher..

Scalp With Me: Real-Time Crypto Trade and 1-Cent Price TargetReal-Time Analysis of a Live Trade: Breaking Down Key Patterns and Strategy for a Fast Profit
NASDAQ:RARE
💰 Live Trade Insight: Join me as I analyze and execute a trade for a targeted 1-cent gain.
📈 Pattern Recognition: Learn how to identify consolidation zones and breakouts using Bollinger Bands.
🕒 Multi-Timeframe Strategy: Discover how to determine the dominant trading time frame for precise moves.
⚡ Scalping Tactics: See how to leverage high-volume, short-term price action for quick profits.
🔍 Risk and Reward: Understand the psychology behind short-term trades and how to manage your exits.
🎯 Price Targeting: Gain insights into setting realistic targets and adapting to evolving market conditions.
🛠 Tools of the Trade: Learn how advanced charting setups, like modified moving averages, offer a competitive edge.
🔑 Pro Tips: Why liquidity zones and support/resistance lines are key to timing entries and exits.

Rare more BullishI'm predicting Rare will be heading up pretty soon. Uptrend direction atm. Place Below your price Predictions targets.

RARE — Trend ContinuationThis one is not like my other picks because it already did a powerful breakout and is already in an uptrend.
After a golden ratio retracement back to support and trendline breakout+retest, this token now offers a great entry opportunity before the next wave up starts.
BTC pair is on support after a channel breakout:
If it reaches its 2021 highs again, it will be 20-30x from the current price.

.4-.5 If $RARE Holds StrongIf NASDAQ:RARE can continue it's momentum. I see no reasons for it not to hit these marks.

.3 $RARE if and when it breaksIt needs to break the flag, of course. But when it does, it will hopefully be to the upside and the target is .3.


RAREUSDLong Opportunity on RAREUSD
3*2=7
1% of total account value.
Risk warning: Buying, selling, holding and partaking in futures trading of cryptocurrencies are activities that are subject to high market risk. The volatile and unpredictable nature of the price of cryptocurrencies may result in significant loss. We will not accept liability for any loss or damage, including without limitation to, any loss of profit, which may arise directly or indirectly from the use of or reliance on such information.

RARE TA - Already PumpedHere are the indicators for RARE. It already pumped but can be observed for education. Don't be someones exit liquidity!


rare/usdTesting/tracking elliot wave theory. Please do not trade off idea without S/L. Not financial advice. This is what I mean when I say a coin is too new or doesn't have enough data. I can't just predict wave counts without a previous trend, with that being said; Here's an attempt to chart one lol
